Amy Miller
Associate Director of Private Equity
In private markets, secondary transactions have increasingly gained attention and acceptance as a viable liquidity option for both general partners (“GPs”) and limited partners (“LPs”). During the first half of 2025, secondary market volume reached record levels, surpassing $100 billion for the first time in history. Specifically, volume totaled $102 billion in the first six months of the year, with a nearly even split between LP-led (53%) and GP-led (47%) transactions. To put this in perspective, secondary transaction volume for the entirety of 2022 was $103 billion. Although dry powder has declined in recent months — from $216 billion in 2024 to $171 billion — fundraising is expected to more than offset this decrease, with $218 billion projected to be raised over the next year.
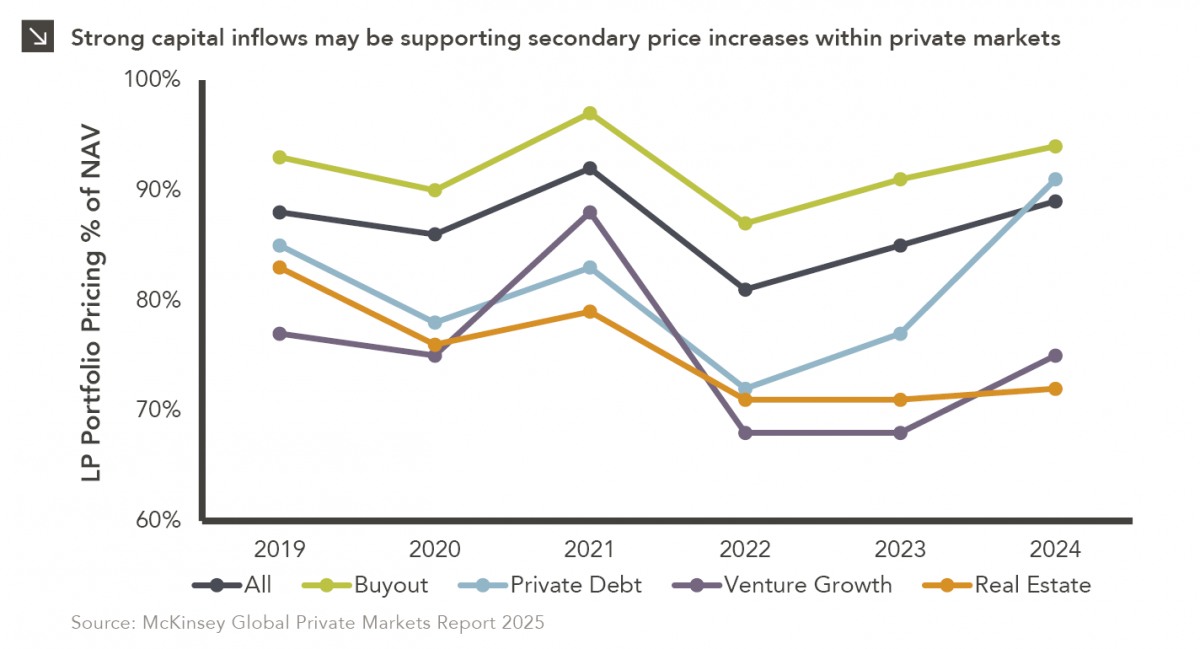
As is common with most asset classes, increased market participation leads to more capital being raised and deployed, which, in turn, drives asset prices higher. The secondary market follows this same trend. Typically, secondary transactions are priced at a discount to the net asset value (“NAV”) of the assets or stakes being sold. However, secondary pricing across all private asset classes increased in 2024, reaching 89% of NAV (up from 85% in 2023). Buyout secondaries saw the highest pricing last year, trading at 94% of NAV, while pricing of private debt secondaries jumped from 77% of NAV in 2023 to 91% in 2024. In contrast, real estate secondaries traded at the lowest percentage of NAV, settling at 72% in 2024. This figure is more consistent with the 71% trading value exhibited by real estate secondaries in 2022 and 2023.
This brings us to the central question of this piece: What’s it all worth? Simply put, whatever someone is willing to pay! But how do we value an asset purchased at a discount? Can we trust the original valuation? Historically, secondary buyers have tended to mark acquired assets up relative to the previous owner’s NAV shortly after the transaction closes, but is this a fair and accurate way to value an asset? If buyers conduct thorough due diligence, their own assessments of a company or portfolio will inform their willingness to pay market-clearing prices, meaning pricing is not determined solely by the current value of an asset. Indeed, buyer perspectives on future growth potential, exit opportunities, and comparable market transactions all influence secondary market pricing. Additionally, recent strong capital inflow for the asset class may be putting pressure on acquirers to put money to work, potentially contributing to the recent uptick in pricing.
Print PDF
The opinions expressed herein are those of Marquette Associates, Inc. (“Marquette”), and are subject to change without notice. This material is not financial advice or an offer to purchase or sell any product. Marquette reserves the right to modify its current investment strategies and techniques based on changing market dynamics or client needs.

07.27.2026
The rapid growth of non-traded business development companies (BDCs), which are investment vehicles that pool investor capital to make loans…

07.24.2026
This video is a recording of a live webinar held July 23 by Marquette’s research team analyzing the first half…

07.20.2026
Our most recent Chart of the Week publication discussed how the AI investment opportunity has expanded beyond…

07.13.2026
One of the enduring lessons of the California Gold Rush is that the greatest fortunes were often made not by…

07.06.2026
Since traditional exit routes have remained constrained in recent years due to higher interest rates, valuation gaps, and a subdued…

06.29.2026
This week’s chart highlights the varying return profiles across key infrastructure sectors by illustrating the split between income and capital…
Research alerts keep you updated on our latest research publications. Simply enter your contact information, choose the research alerts you would like to receive and click Subscribe. Alerts will be sent as research is published.
We respect your privacy. We will never share or sell your information.
If you have questions or need further information, please contact us directly and we will respond to your inquiry within 24 hours.
Contact Us >