04.02.2026
1Q 2026 Market Insights Webinar
Please join Marquette’s research team for our 1Q 2026 Market Insights Webinar analyzing the first quarter across the economy and various…
The chart above illustrates the debt ceiling and the amount of gross debt as a percentage of GDP. The debt ceiling ($14.3 trillion) is the total amount of money that the United States government is authorized to borrow to meet its existing legal obligations, including Social Security and Medicare benefits, military salaries, interest on the national debt, tax refunds, and other payments. The total debt outstanding is the sum of the debt held by the public and intergovernmental holdings. Total GDP through 1Q11 was approximately $15.0 trillion. The debt to GDP ratio is currently at 95%, a 46% increase from the pre-crisis ratio (65%); the significant increase is an indication of the amount of stimulus enacted to save the financial system from collapse.
There has been much discussion over the past several months regarding increasing the debt limit. Currently, the Treasury Department projects that the U.S. will exhaust its borrowing authority under the current debt ceiling on August 2, 2011. If politicians cannot come to an agreement in the coming weeks, the government could default on its legal obligations.
Much of the debate in recent months is based upon political posturing between democrats and republicans. There have been nearly 100 instances since 1940 that Congress has permanently raised, temporarily extended, or revised the definition of the debt ceiling; debt as a percentage of GDP has averaged approximately 59% over that timeframe. The U.S. debt ceiling reached $1 trillion in 1980 and has risen by a considerable amount since that point. It is worth noting that the last time debt to GDP was over 100% was WWII, but the years after the run up in debt featured a period of sustained economic growth. In theory, the temporary stimulus that has entered the system will allow for increased economic growth going forward so that growth will allow for the percentage of debt to GDP to fall. Growth alone will not solve the overarching problem of debt, though, so policy makers need to work together to ensure fiscal responsibility while fostering economic growth.
The opinions expressed herein are those of Marquette Associates, Inc. (“Marquette”), and are subject to change without notice. This material is not financial advice or an offer to purchase or sell any product. Marquette reserves the right to modify its current investment strategies and techniques based on changing market dynamics or client needs.

04.02.2026
Please join Marquette’s research team for our 1Q 2026 Market Insights Webinar analyzing the first quarter across the economy and various…
03.30.2026
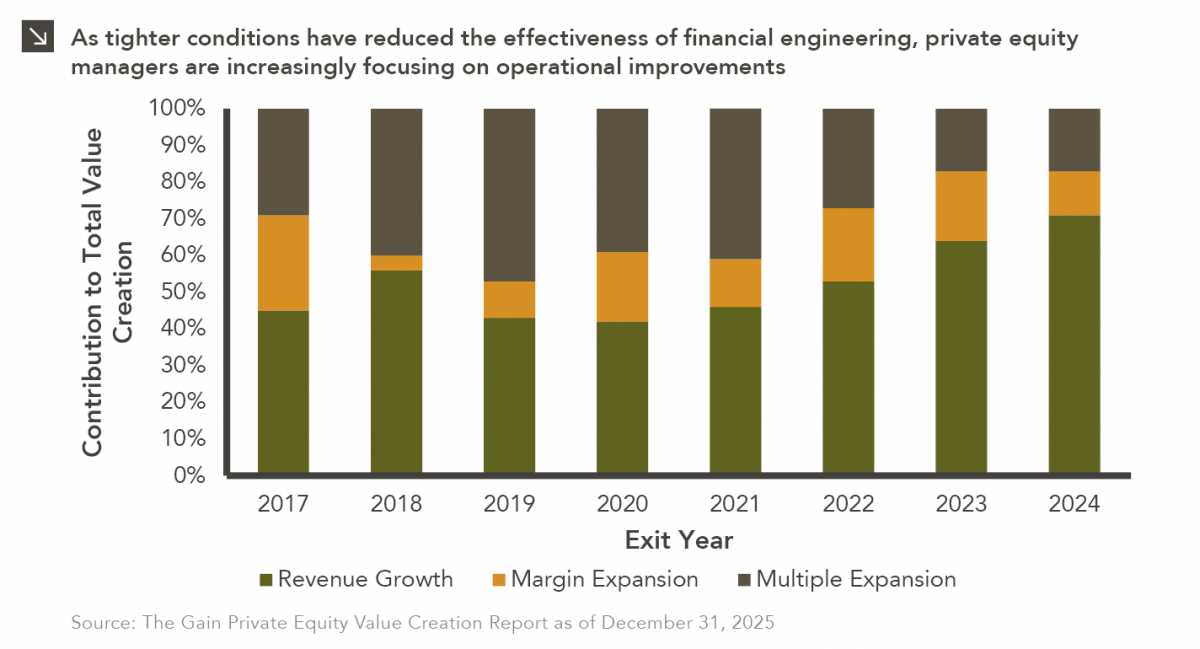
In the period between 2009 and 2022, private equity managers thrived amid an environment of low interest rates and rising…

03.23.2026
Global energy costs have risen sharply this month due to a convergence of geopolitical shocks, as critical infrastructure and transport…

03.16.2026
This week’s chart illustrates a clear structural shift in the fundraising dynamics of North American closed-end real estate funds over…

03.09.2026
Warren Buffett once implored investors to “be greedy when others are fearful,” and this sage advice is certainly applicable to…

03.02.2026
Recent market dynamics in the software sector reflect a sharp shift in investor sentiment driven primarily by concerns that advances…
Research alerts keep you updated on our latest research publications. Simply enter your contact information, choose the research alerts you would like to receive and click Subscribe. Alerts will be sent as research is published.
We respect your privacy. We will never share or sell your information.
If you have questions or need further information, please contact us directly and we will respond to your inquiry within 24 hours.
Contact Us >