09.14.2026
No More Free Lunch?
There are many great things about working at Marquette Associates, but “Free Lunch Tuesday” is right at the top of…


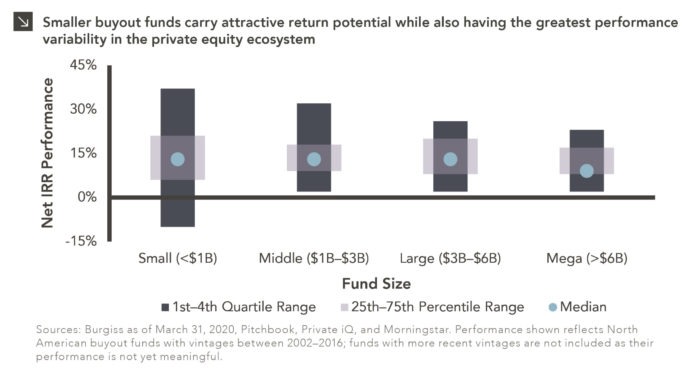
As private equity matures further as an asset class, median private equity returns will continue to move closer to the public markets. Nevertheless, as a result of active management and private market inefficiencies, the top quartile to median spread for private equity is still more than 2x greater than it is for public market-oriented managers. When we take a closer look at fund performance within private equity, there is significantly more upside as well as performance variability for smaller buyout funds as compared to larger buyout funds. As seen in this week’s chart, funds that are less than $1B in size had a median Net IRR of 13%, a 1st quartile range of 21–37%, and a 4th quartile range of -10–6% whereas funds greater than $6B in size had a median Net IRR of 9%, a 1st quartile range of 17–23%, and a 4th quartile range of 2–8%.
This performance dispersion is largely driven by smaller funds sourcing opportunities outside of intermediated processes, leveraging a repeatable and focused operational playbook to professionalize and grow portfolio companies quickly, and a growing list of paths to liquidity, including larger funds with an increasing amount of dry powder that are sourcing investments out of smaller managers’ funds. With that said, larger funds buy companies that are typically more mature, have built-out teams, and are capable of weathering business shocks with greater success, which accounts for the tighter band of outcomes at the larger end of the market.
Due to COVID and an inability to meet with potential investors in person, first-time funds and emerging managers which typically fall in the “small” fund size had difficulty raising capital in 2020. This dynamic is expected to have two significant effects on the 2021 private equity ecosystem: 1) first-time funds and emerging managers fundraising is likely to be more active in 2021 and 2) dry powder has been further concentrated in larger funds, which should create an increasingly attractive exit environment for smaller funds.
Given the compelling upside opportunity of investing in smaller funds and an expected increase in the number of these funds raising capital in 2021, these managers represent an attractive area of the private equity market to be allocating capital towards. Given the greater performance variability of smaller funds, allocations to funds at this size should be focused within a program that allows for a number of high-quality commitments, such as those provided by fund-of-funds.
Print PDF > What Is the Most Attractive Segment of the Private Equity Market
The opinions expressed herein are those of Marquette Associates, Inc. (“Marquette”), and are subject to change without notice. This material is not financial advice or an offer to purchase or sell any product. Marquette reserves the right to modify its current investment strategies and techniques based on changing market dynamics or client needs.

09.14.2026
There are many great things about working at Marquette Associates, but “Free Lunch Tuesday” is right at the top of…

09.08.2026
Over the last several years, emerging market debt (EMD) has faced several headwinds, with rising yields across other fixed income…

08.31.2026
Private equity has always had a few portfolio companies that refused to leave the party. Today, however, the industry appears…

08.24.2026
The global bond market is facing renewed pressure as investors demand higher yields to hold long-dated government debt, pushing borrowing…

08.17.2026
As a college football player struggling to put on mass, the “supersizing” deal at McDonald’s was hard to beat. For…

08.10.2026
After reaching nearly ¥164 per dollar, its weakest level in roughly four decades, the yen had become a source of…
Research alerts keep you updated on our latest research publications. Simply enter your contact information, choose the research alerts you would like to receive and click Subscribe. Alerts will be sent as research is published.
We respect your privacy. We will never share or sell your information.
If you have questions or need further information, please contact us directly and we will respond to your inquiry within 24 hours.
Contact Us >