James Torgerson
Senior Research Analyst


“One man’s trash is another man’s treasure” may be a cliché, but it has never been more applicable to the below-investment grade, or junk, market. As the macroeconomic backdrop has proven to be more resilient than investors feared heading into 2023, one of the primary beneficiaries has been CCC corporates — traditionally the riskiest securities within the high yield and leveraged loan markets. CCC bonds and loans are the least credit-worthy within their respective markets and tend to perform poorly in periods of economic stress. With the economy so far avoiding recession, this segment of the market has posted significant gains year-to-date. CCC bonds and loans were up 11.0% and 8.3% through the first half, respectively, notably outperforming the broader high yield and leveraged loan indices, up 5.8% and 6.3%, and especially the highest-rated, or BB, segments of each market, up 4.5% and 4.6%, respectively.
On top of better-than-feared macroeconomic conditions, other factors have contributed to the junk rally in these markets. Leveraged credit balance sheets, even amongst the lowest-rated issuers, remain well positioned to weather headwinds. High yield issuer leverage is at a 10-year low while leveraged loan issuer leverage levels are at multi-year lows with interest coverage metrics slightly below all-time highs. Defaults are expected to increase, though only to the long-term average of the asset class, assuaging fears of a wave of defaults. Additionally, market technicals have helped fuel this rally as issuance has remained light, causing what supply is out there to benefit from a continual bid due to the elevated yield on these securities. All of this said, CCCs are still typically the riskiest part of the fixed income market, and continued performance hinges on the notoriously-unpredictable economy.
Print PDF > Credit Trash is Return Treasure
The opinions expressed herein are those of Marquette Associates, Inc. (“Marquette”), and are subject to change without notice. This material is not financial advice or an offer to purchase or sell any product. Marquette reserves the right to modify its current investment strategies and techniques based on changing market dynamics or client needs.

02.02.2026
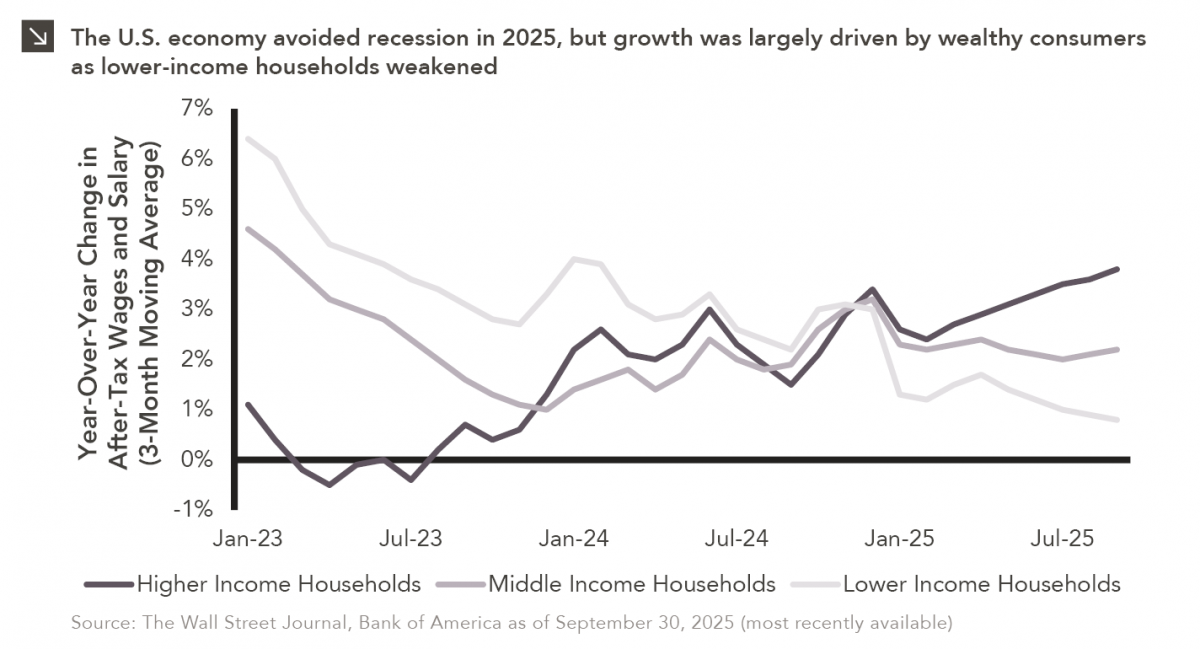
Macroeconomic forecasting is challenging in the best of times and proved downright impossible in 2025, which saw high levels of…

01.26.2026
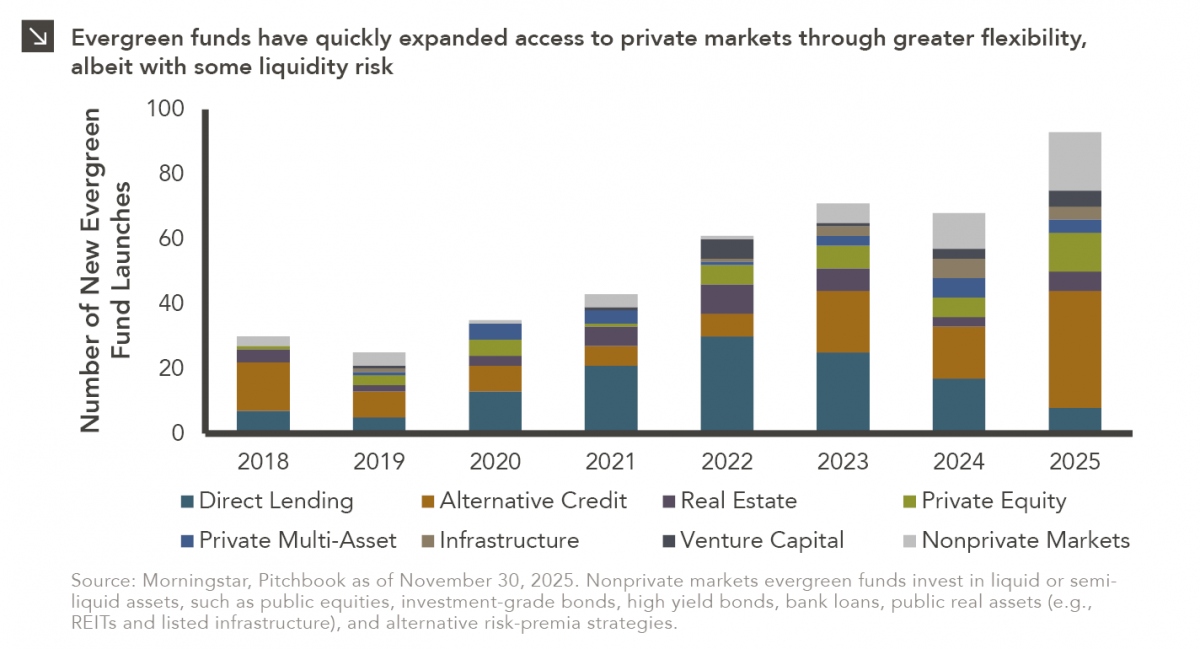
In recent years, access to traditionally illiquid private markets has expanded through the rapid growth of evergreen funds, which provide…
01.22.2026
Anyone who has gone snowmobiling knows it can be simultaneously exhilarating and terrifying. Throttling across snow and through a forest…

01.20.2026
Last week, Alphabet joined NVIDIA, Microsoft and Apple as the only companies to ever reach a market capitalization of $4…

01.07.2026
This video is a recording of a live webinar held January 15 by Marquette’s research team analyzing 2025 across the…

01.12.2026
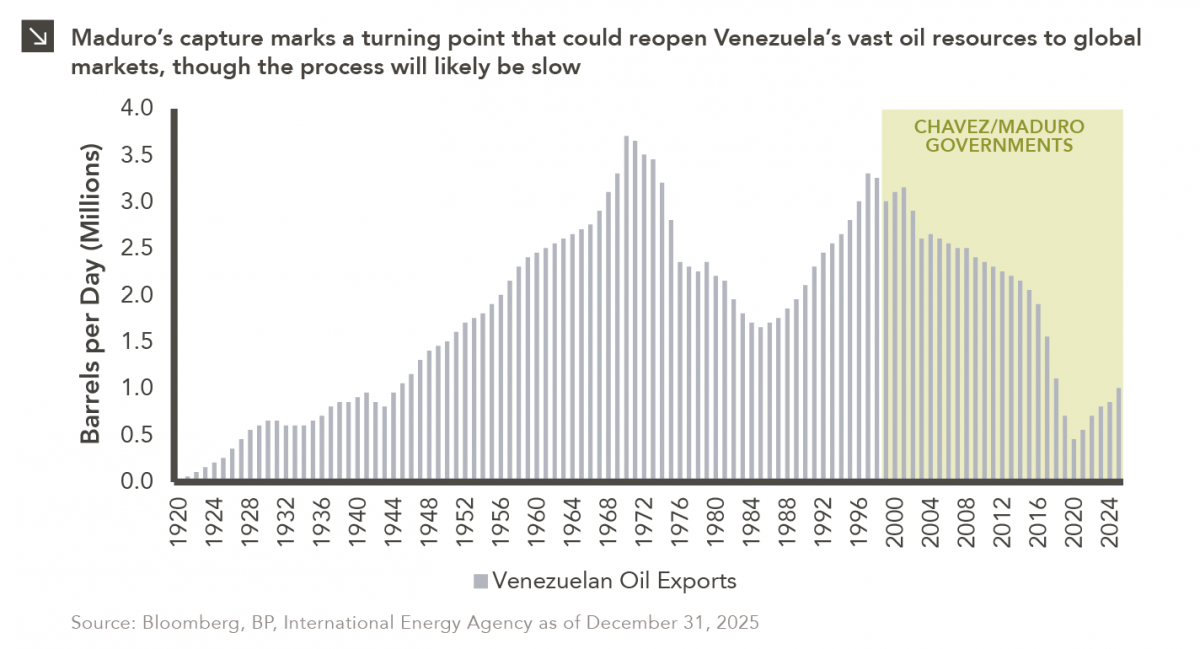
The capture of Venezuelan president Nicolás Maduro is a watershed moment for a country whose natural resource economy has been…
Research alerts keep you updated on our latest research publications. Simply enter your contact information, choose the research alerts you would like to receive and click Subscribe. Alerts will be sent as research is published.
We respect your privacy. We will never share or sell your information.
If you have questions or need further information, please contact us directly and we will respond to your inquiry within 24 hours.
Contact Us >