Frank Valle, CFA, CAIA
Associate Director of Fixed Income


As the leaves change to autumn and the authors cheer on their Fighting Leathernecks, fall is the perfect time for investors to reassess their fixed income portfolios. Fixed income is a hybrid security that offers both offensive and defensive properties. Much like a good football team, a fixed income portfolio needs to combine a strong offense with a solid defense.
Some strategies provide more offensive characteristics while others are more defensive. Portfolios with too much offense act like the Greatest Show on Turf. They do well when the economy is strong, but falter in down markets. Conversely, a fixed income portfolio that is overly reliant on defensive strategies will do well in a risk-off environment but will struggle in a strong economy like the Super Bowl Shufflin’ ’85 Bears.
While those were great teams, they were not a dynasty that stood up to the test of time. To build an all-weather fixed income portfolio that will perform in multiple market environments, an investor needs to balance offense and defense.
Fixed income has three primary objectives: income, diversification, and liquidity. Income, or yield, is what an investor is paid for loaning money to another entity. Fixed income helps to diversify portfolios primarily through duration. When risk assets are selling off, interest rates are generally falling. Duration is what drives fixed income prices higher in such scenarios. Finally, fixed income assets can be a source of liquidity. The weight of these qualities is dependent on if the strategy is more offensive- or defensive-minded.
This white paper outlines offensive and defensive fixed income characteristics and strategies and considerations for investors when building a “gameplan” for their fixed income allocation.
Read > Are You Ready for Some Fixed Income?

The opinions expressed herein are those of Marquette Associates, Inc. (“Marquette”), and are subject to change without notice. This material is not financial advice or an offer to purchase or sell any product. Marquette reserves the right to modify its current investment strategies and techniques based on changing market dynamics or client needs.

10.08.2026
LIVE WEBINAR — OCTOBER 22 Please join Marquette’s research team for our 3Q 2026 Market Insights Webinar…

10.05.2026
For investors, the spookiest thing about October might not be the ghosts and monsters that are bound to show up…

09.28.2026
The phrase “expectations of higher inflation” has become a staple in financial news to explain the increase in nominal U.S….
09.21.2026
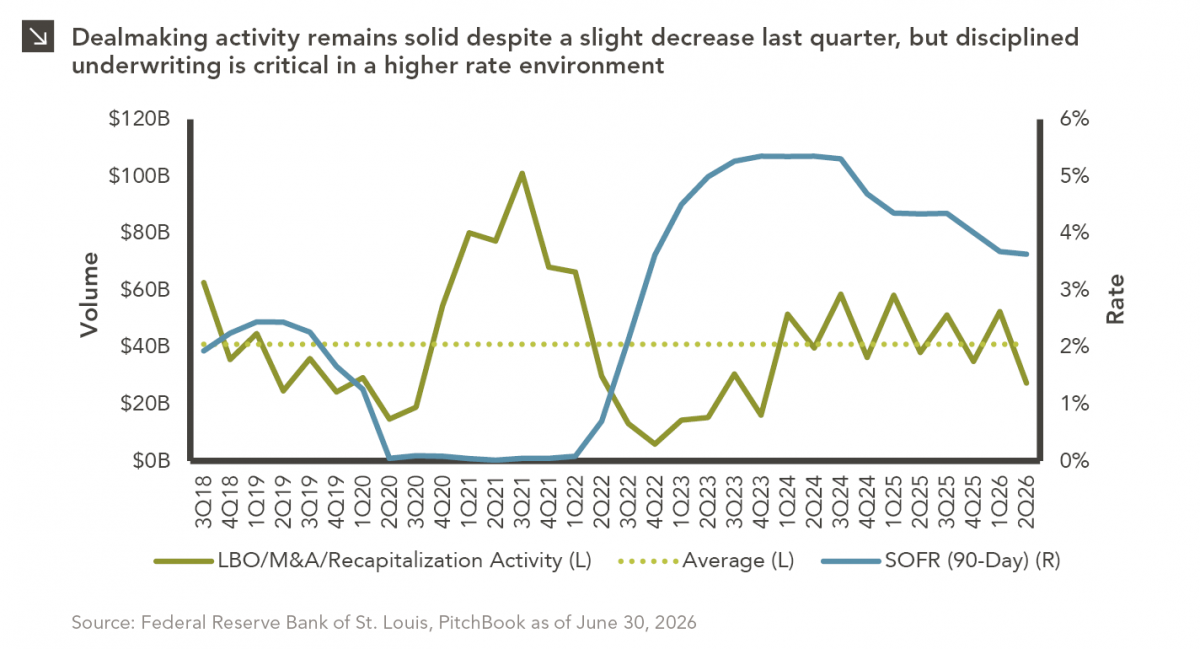
For much of the past several years, the conventional view has been that higher interest rates and stretched valuations would…

09.15.2026
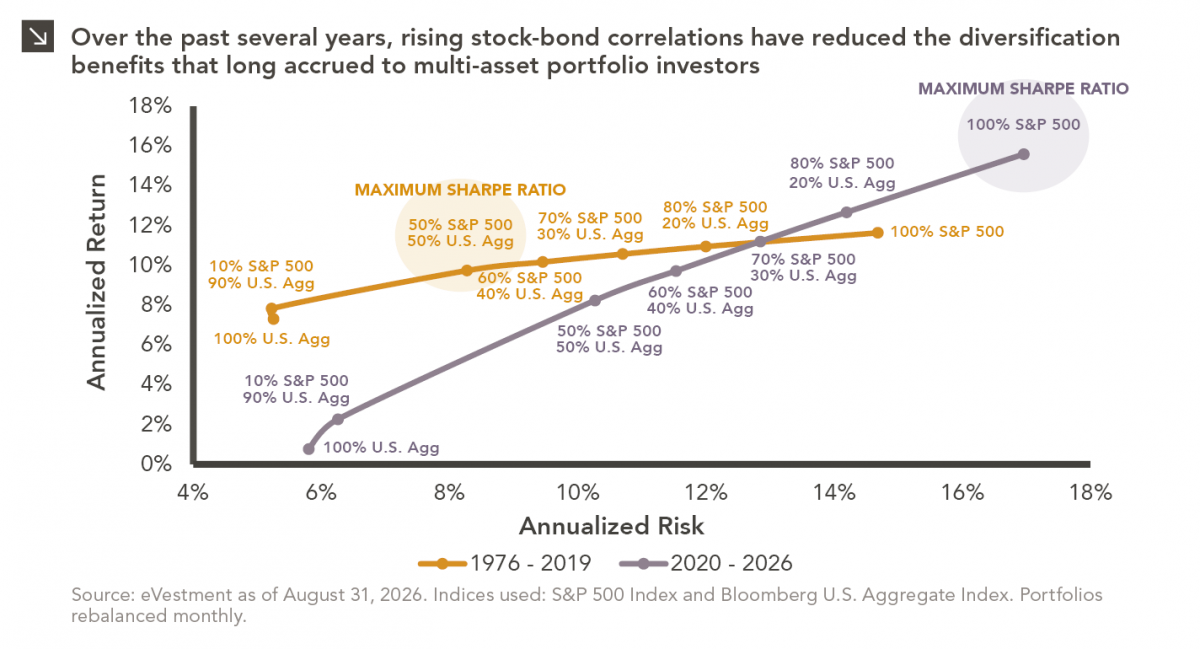
Over the past decade, continuation vehicles (“CV”) have become one of the fastest-growing trends in private equity. Private equity funds…
09.14.2026
There are many great things about working at Marquette Associates, but “Free Lunch Tuesday” is right at the top of…
Research alerts keep you updated on our latest research publications. Simply enter your contact information, choose the research alerts you would like to receive and click Subscribe. Alerts will be sent as research is published.
We respect your privacy. We will never share or sell your information.
If you have questions or need further information, please contact us directly and we will respond to your inquiry within 24 hours.
Contact Us >