Nic Solecki, CBDA
Research Analyst


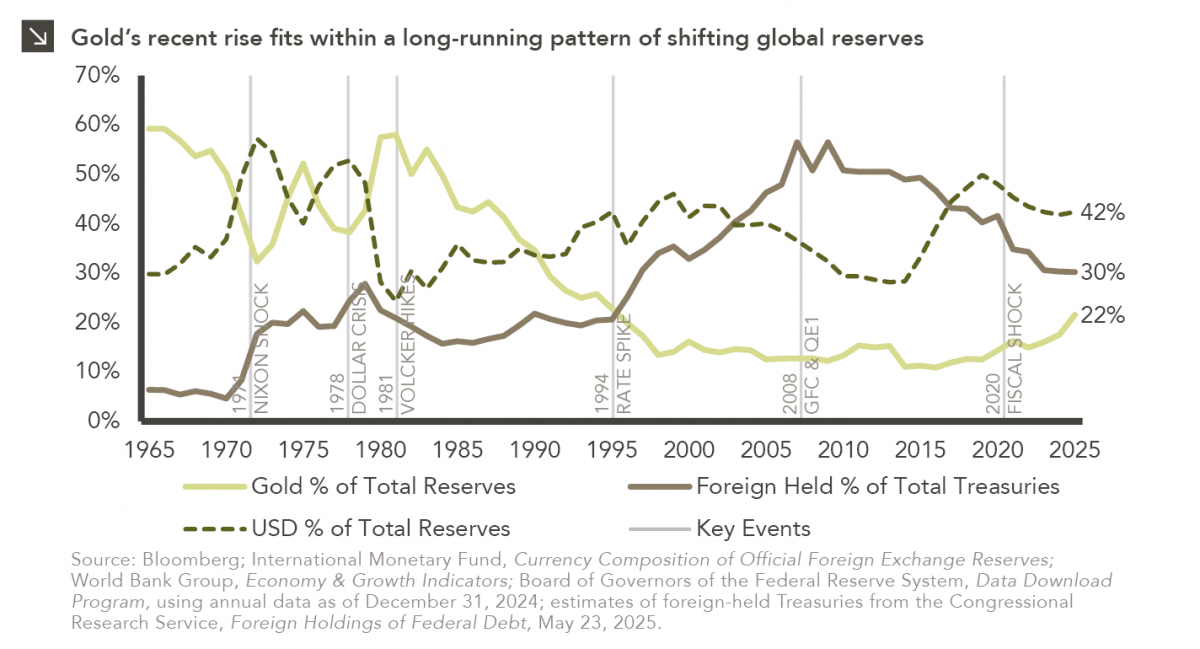
With gold now trading near $4,000 per ounce after a steady multi-year climb, investor attention has turned to the potential role of the commodity in markets and portfolios. Some may view gold’s rise cautiously given shifting perceptions of U.S. policy and debt sustainability, questioning whether the rally reflects a meaningful shift in safe-haven preferences or simply the latest stretch of momentum.
The opinions of most investors have been shaped by an era in which attractive real yields, credible policy, and deep liquidity positioned Treasuries as the world’s premier safe-haven asset. As global reserves and risk frameworks increasingly centered on Treasuries and the dollar, gold’s role as a monetary anchor naturally faded. This week’s chart helps highlight this transition, and the events detailed above underscore how shifts in confidence have shaped market behavior. The Nixon Shock in 1971 ended gold convertibility and closed a monetary era in which trust in the dollar rested on the gold anchor, giving way to one in which confidence hinged on U.S. policy credibility. That credibility was tested early in 1978, when the Dollar Crisis revealed how unsettled the fiat transition remained and required coordinated intervention to steady the currency. By 1981, rate hikes had pushed real yields higher and helped tame inflation, providing the foundation the new system needed. As inflation cooled and credibility strengthened, Treasuries became the stabilizing asset of choice, helping set the conditions for the multi-decade bond bull market that followed (a dynamic that would surface again with the 1994 rate hikes). Decades later, the landscape shifted again with the Global Financial Crisis and quantitative easing by the Federal Reserve. Long-term yields compressed, central bank balance sheets expanded, and the dollar’s share of total reserves began a gradual decline. The pandemic shock in 2020 accelerated these dynamics as debt expanded and real yields turned negative. In recent years, central banks and affiliated institutions have been gradually increasing their gold holdings as a precaution against persistent macroeconomic and geopolitical strains.
Viewed through this lens, gold’s renewed relevance carries a familiar echo. Specifically, the commodity often strengthens when global confidence in the dollar feels tenuous. From this perspective, the recent rally may signal a shift away from a Treasury-centric period rather than any departure from gold’s longstanding function (i.e., a store of value). In that context, conversations regarding the role of gold may broaden from here.
Print PDF
The opinions expressed herein are those of Marquette Associates, Inc. (“Marquette”), and are subject to change without notice. This material is not financial advice or an offer to purchase or sell any product. Marquette reserves the right to modify its current investment strategies and techniques based on changing market dynamics or client needs.

10.12.2026
This week’s chart highlights the accelerating growth of electricity demand in the U.S., which has been driven primarily by the…

10.08.2026
LIVE WEBINAR — OCTOBER 22 Please join Marquette’s research team for our 3Q 2026 Market Insights Webinar…

10.05.2026
For investors, the spookiest thing about October might not be the ghosts and monsters that are bound to show up…

09.28.2026
The phrase “expectations of higher inflation” has become a staple in financial news to explain the increase in nominal U.S….

09.21.2026
For much of the past several years, the conventional view has been that higher interest rates and stretched valuations would…

09.14.2026
There are many great things about working at Marquette Associates, but “Free Lunch Tuesday” is right at the top of…
Research alerts keep you updated on our latest research publications. Simply enter your contact information, choose the research alerts you would like to receive and click Subscribe. Alerts will be sent as research is published.
We respect your privacy. We will never share or sell your information.
If you have questions or need further information, please contact us directly and we will respond to your inquiry within 24 hours.
Contact Us >