Annie Huang
Research Analyst


When Benchmark, one of Silicon Valley’s most renowned early-stage venture capital firms, closed $2 billion across two new funds this month (including its first-ever dedicated growth vehicle at roughly $1.3 billion), headlines were made. For nearly two decades, Benchmark was one of the industry’s most disciplined organizations, with funds capped at around $500 million and a conviction that backing the right companies at the right prices was preferable to deploying capital at scale. That thesis ultimately produced one of the strongest track records in venture capital.
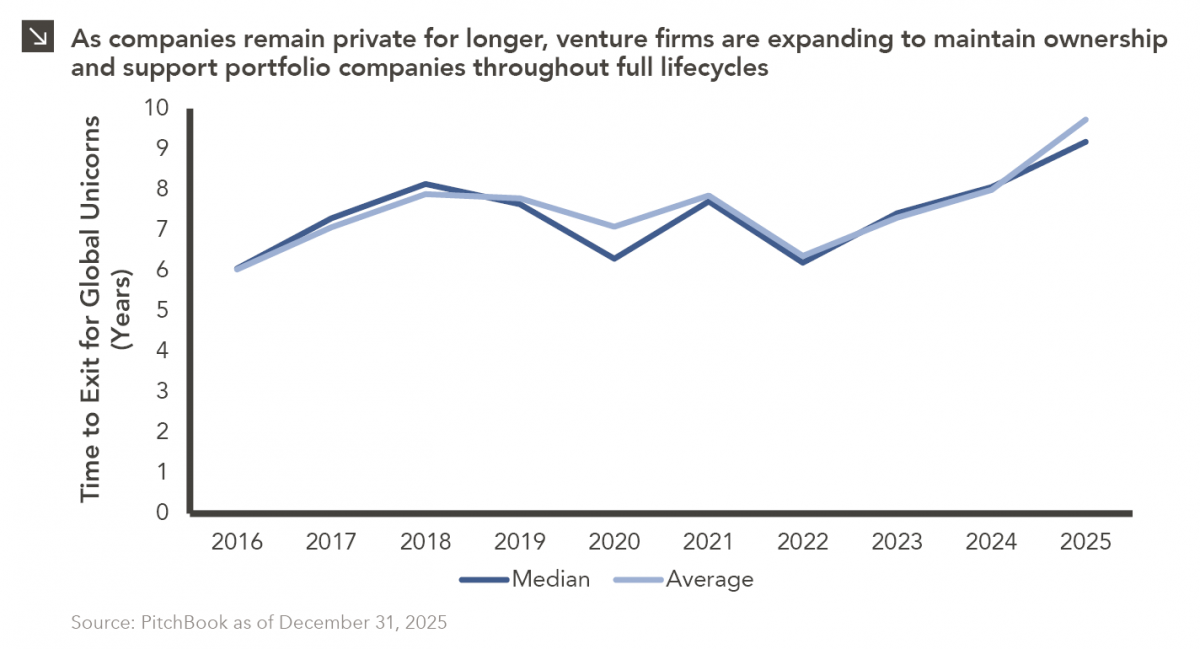
Benchmark’s more recent moves are indicative of broader market dynamics. Indeed, VC-backed businesses are staying private for longer, an increasing share of enterprise value is being created after the traditional venture stage, and the capital required to participate in the initial phases of a company’s growth is now greater than what early-stage funds were built to provide. According to PitchBook, the median time to exit for unicorn companies was 9.2 years as of the end of last year. For an early-stage investor, that figure represents nearly a decade during which ownership stakes are tested via various financing rounds. For instance, a $400 million fund with pro-rata rights can participate in early rounds, but maintaining meaningful ownership across 10 years of financing requires capital that traditional venture funds were not designed to deploy. This means that the investor who backed the right company at the seed stage but lacked the capital to hold the position through subsequent financing rounds effectively did the difficult work of selection for someone else’s benefit.
In recent time, leading firms including Founders Fund, a16z, Thrive Capital, and Sequoia have launched dedicated growth vehicles, aiming to build out the capacity required to support portfolio companies across full lifecycles and avoid handing them off at the growth stage. It is important to point out, however, that growth investing is not simply venture investing with larger check sizes. Specifically, entry valuations are higher at this stage, requiring investors to underwrite not just a company’s potential but the return achievable at a given price. To that point, outcomes depend more heavily on public market conditions and exit timing, which are factors that no investor can fully control. In conclusion, venture capital is entering an era of convergence in which the most competitive firms are defined not by the stage at which they invest, but by their ability to support exceptional companies across a full lifecycle, meaning growth capabilities are increasingly becoming table stakes for venture firms seeking to build enduring franchises.
Print PDF
The opinions expressed herein are those of Marquette Associates, Inc. (“Marquette”), and are subject to change without notice. This material is not financial advice or an offer to purchase or sell any product. Marquette reserves the right to modify its current investment strategies and techniques based on changing market dynamics or client needs.

10.12.2026
This week’s chart highlights the accelerating growth of electricity demand in the U.S., which has been driven primarily by the…

10.08.2026
LIVE WEBINAR — OCTOBER 22 Please join Marquette’s research team for our 3Q 2026 Market Insights Webinar…

10.05.2026
For investors, the spookiest thing about October might not be the ghosts and monsters that are bound to show up…

09.28.2026
The phrase “expectations of higher inflation” has become a staple in financial news to explain the increase in nominal U.S….

09.21.2026
For much of the past several years, the conventional view has been that higher interest rates and stretched valuations would…

09.15.2026
Over the past decade, continuation vehicles (“CV”) have become one of the fastest-growing trends in private equity. Private equity funds…
Research alerts keep you updated on our latest research publications. Simply enter your contact information, choose the research alerts you would like to receive and click Subscribe. Alerts will be sent as research is published.
We respect your privacy. We will never share or sell your information.
If you have questions or need further information, please contact us directly and we will respond to your inquiry within 24 hours.
Contact Us >