Kevin Anderson, CFA
Vice President


This week’s chart chronicles monthly U.S. oil production sourced from the seven major land production zones from January 2011 to April 2017. The price of oil experienced volatility over recent years resulting from macroeconomic factors like OPEC’s pump-at-will strategy and the subsequent supply glut that forced U.S. producers to reduce output. However, following OPEC’s production cut agreement in late 2016, U.S. oil production is on the rise, supported by rig productivity gains in both new and legacy wells as well as reduced capital costs. Gains from legacy wells have been particularly significant in the Eagle Ford and Bakken Regions since 2012, while in the Permian region an almost fourfold increase in new rigs from 2015 to 2017 helped solidify the area as the dominant production region. Overall, net imports of petroleum products as a share of consumption dropped from about 49% in 2010 to about 25% in 2015, showing progress towards a more energy independent U.S.
OPEC’s production cuts and a lower global supply signal positive news for U.S. producers. Khalid Al-Falih, the newly appointed Oil Minister of Saudi Arabia, committed to lengthening the OPEC supply cut on May 7th. “I am rather confident the agreement will be extended into the second half of the year and possibly beyond,” said Al-Falih. Lower breakeven costs and reduced supply from OPEC nations could incentivize U.S. producers to further ramp up production going forward.

The opinions expressed herein are those of Marquette Associates, Inc. (“Marquette”), and are subject to change without notice. This material is not financial advice or an offer to purchase or sell any product. Marquette reserves the right to modify its current investment strategies and techniques based on changing market dynamics or client needs.

08.31.2026
Private equity has always had a few portfolio companies that refused to leave the party. Today, however, the industry appears…

08.24.2026
The global bond market is facing renewed pressure as investors demand higher yields to hold long-dated government debt, pushing borrowing…

08.17.2026
As a college football player struggling to put on mass, the “supersizing” deal at McDonald’s was hard to beat. For…

08.10.2026
After reaching nearly ¥164 per dollar, its weakest level in roughly four decades, the yen had become a source of…

08.03.2026
In the cinematic masterpiece Rocky IV, Rocky gets dazed by his opponent, Captain Ivan Drago, and complains that he sees…
07.27.2026
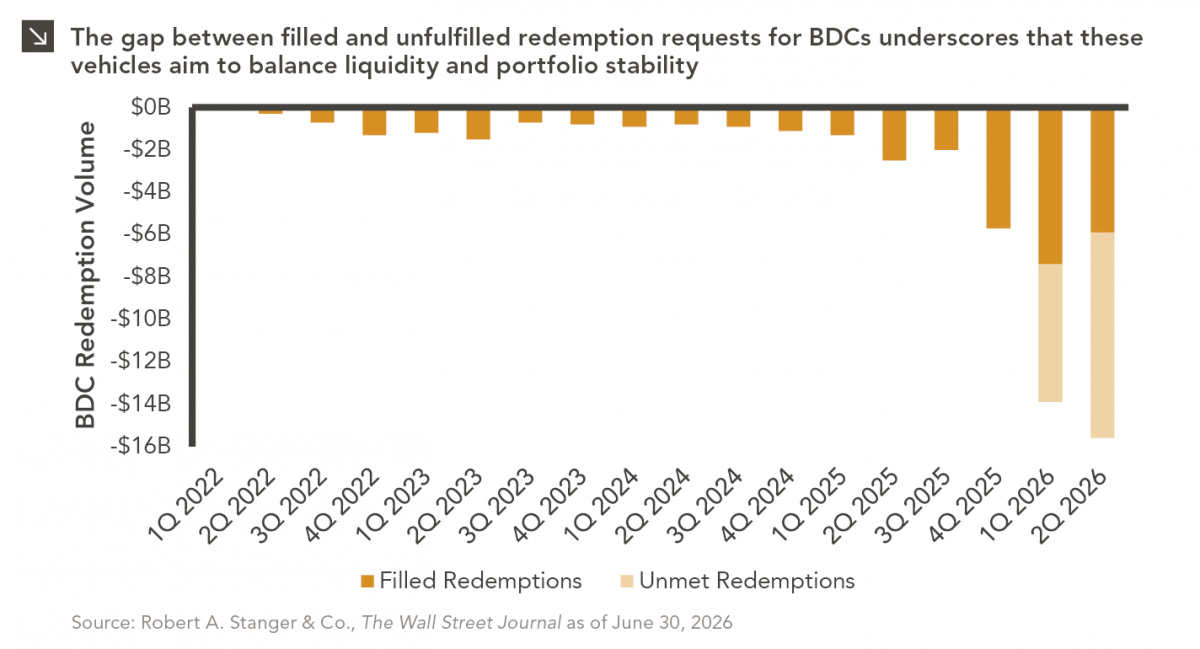
The rapid growth of non-traded business development companies (BDCs), which are investment vehicles that pool investor capital to make loans…
Research alerts keep you updated on our latest research publications. Simply enter your contact information, choose the research alerts you would like to receive and click Subscribe. Alerts will be sent as research is published.
We respect your privacy. We will never share or sell your information.
If you have questions or need further information, please contact us directly and we will respond to your inquiry within 24 hours.
Contact Us >