Greg Leonberger, FSA, EA, MAAA, FCA
Partner, Director of Research


2018 Investment Symposium flash talk by Greg Leonberger, FSA, EA, MAAA
In this session, Greg explores the effects of various policy changes in the U.S. and how they could impact investor portfolios. In particular, we examine the effects of tax reform, U.S.-China tariff escalation and finally, the upcoming mid-term elections. While the ultimate impact of each is not yet known, we highlight trends and sensitivities that can help guide prudent portfolio decisions in the coming months.
A summary of this flash talk can be downloaded here.

The opinions expressed herein are those of Marquette Associates, Inc. (“Marquette”), and are subject to change without notice. This material is not financial advice or an offer to purchase or sell any product. Marquette reserves the right to modify its current investment strategies and techniques based on changing market dynamics or client needs.

10.19.2026
Since 1980, the S&P 500 Index has generally performed well in the weeks surrounding U.S. midterm elections. Specifically, the index…

10.08.2026
LIVE WEBINAR — OCTOBER 22 Please join Marquette’s research team for our 3Q 2026 Market Insights Webinar…

09.28.2026
The phrase “expectations of higher inflation” has become a staple in financial news to explain the increase in nominal U.S….
08.03.2026
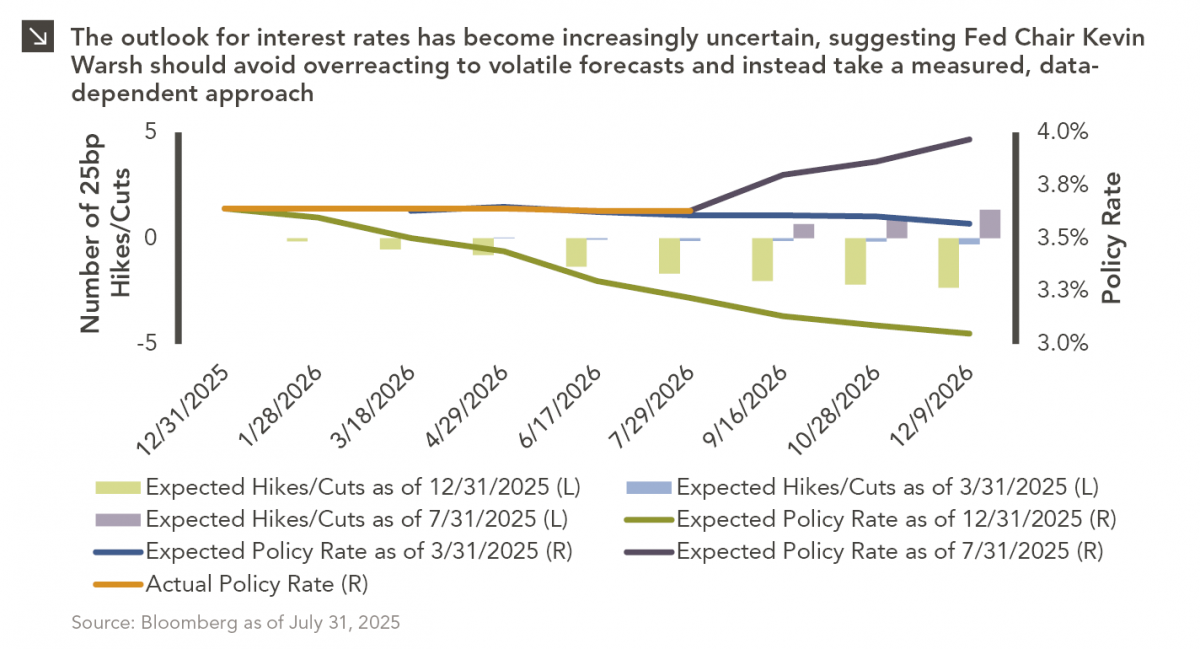
In the cinematic masterpiece Rocky IV, Rocky gets dazed by his opponent, Captain Ivan Drago, and complains that he sees…

07.24.2026
This video is a recording of a live webinar held July 23 by Marquette’s research team analyzing the first half…

07.22.2026
The usual midyear version of these letters has touched on year-to-date performance as well as the most influential macroeconomic and…
Research alerts keep you updated on our latest research publications. Simply enter your contact information, choose the research alerts you would like to receive and click Subscribe. Alerts will be sent as research is published.
We respect your privacy. We will never share or sell your information.
If you have questions or need further information, please contact us directly and we will respond to your inquiry within 24 hours.
Contact Us >