Evan Frazier, CFA, CAIA
Senior Research Analyst


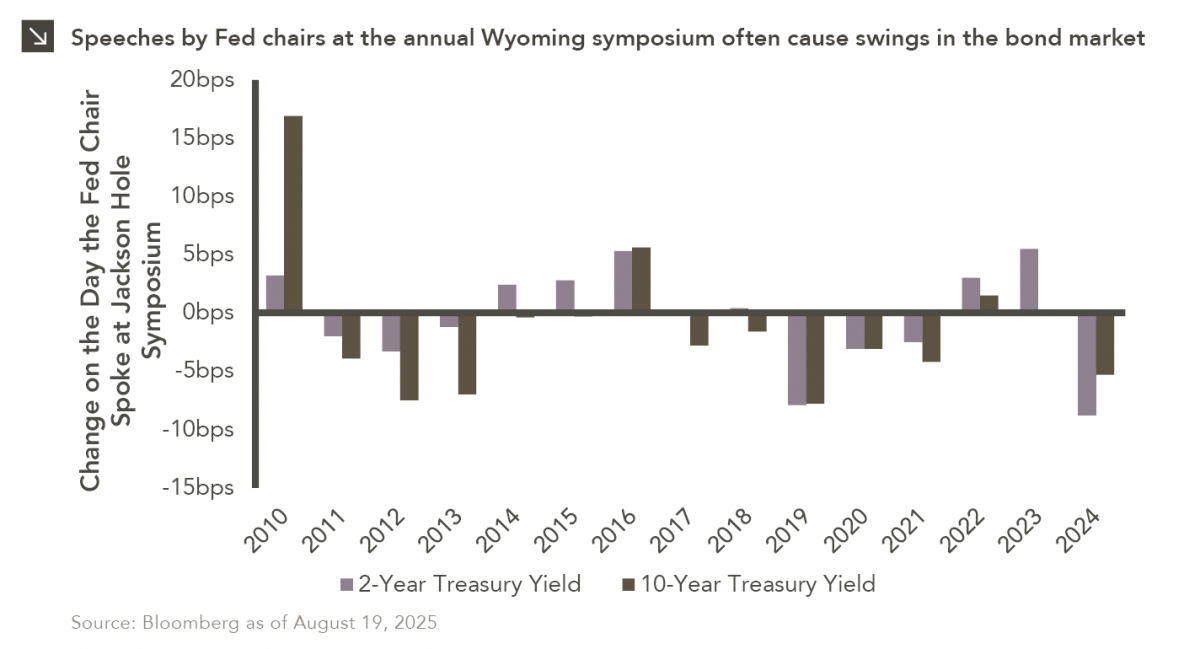
Predictions that the Federal Reserve is set to lower interest rates will be put to the test this week as Chair Jerome Powell prepares to outline his view of the economy at the central bank’s annual symposium in Jackson Hole, Wyoming. Most anticipate a more dovish tone from Powell in his remarks on Friday due to weakening labor market dynamics, though recent inflation figures have tempered some of that optimism. While a monetary policy decision will not be made at the Jackson Hole symposium, Powell’s comments are sure to provide insight into what might occur at the Fed’s September meeting, at which there is an 85% chance of a 25 basis point rate cut according to prediction markets. All told, the central bank has three remaining opportunities to make changes to its policy rate in 2025.
Comments from Fed chairs at Jackson Hole have proven significant in the past. For instance, Powell warned that controlling inflation would require economic pain in his speech three years ago, and these remarks sent short-term yields higher. Additionally, at last year’s symposium, he indicated that the Fed was prepared to lower borrowing costs from multi-decade highs, triggering a sharp drop in both the 2- and 10-year Treasury. Yields have retreated across most maturities in recent weeks following a lackluster July jobs report, with the 2-year yield now hovering around 3.75%, meaning a material reaction to Powell’s speech could send short-term yields to multi-year lows.
In the weeks ahead, attention will shift from Jackson Hole to the August jobs report, which could solidify expectations for an interest rate reduction in September. Investors should note, however, that monetary easing would come at a time when inflation remains above target and fiscal stimulus from the Trump administration’s recent spending package looms large. Those dynamics, combined with concerns about political interference at the Fed and recent changes in leadership at the Bureau of Labor Statistics, could lead investors to demand higher compensation for holding longer-dated Treasuries.
Print PDF
The opinions expressed herein are those of Marquette Associates, Inc. (“Marquette”), and are subject to change without notice. This material is not financial advice or an offer to purchase or sell any product. Marquette reserves the right to modify its current investment strategies and techniques based on changing market dynamics or client needs.

10.12.2026
This week’s chart highlights the accelerating growth of electricity demand in the U.S., which has been driven primarily by the…

10.08.2026
LIVE WEBINAR — OCTOBER 22 Please join Marquette’s research team for our 3Q 2026 Market Insights Webinar…

10.05.2026
For investors, the spookiest thing about October might not be the ghosts and monsters that are bound to show up…

09.28.2026
The phrase “expectations of higher inflation” has become a staple in financial news to explain the increase in nominal U.S….

09.21.2026
For much of the past several years, the conventional view has been that higher interest rates and stretched valuations would…

09.14.2026
There are many great things about working at Marquette Associates, but “Free Lunch Tuesday” is right at the top of…
Research alerts keep you updated on our latest research publications. Simply enter your contact information, choose the research alerts you would like to receive and click Subscribe. Alerts will be sent as research is published.
We respect your privacy. We will never share or sell your information.
If you have questions or need further information, please contact us directly and we will respond to your inquiry within 24 hours.
Contact Us >