Greg Leonberger, FSA, EA, MAAA, FCA
Partner, Director of Research


As markets swirl and stagflation fears mount, what should investors do?
Our newsletter last week outlined the broad context of President Trump’s new tariff policy as well as the most notable market impacts. Granted, the news seems to change daily, as does the market’s reaction; trying to pen a targeted newsletter is an almost worthless endeavor because by the time the ink has dried, markets have shifted due to another policy pivot. In the short term, the omnipresent cloud of uncertainty will continue to drive market volatility and investor sentiment. The best recipe for investors to weather this storm is patience and discipline, both of which can be difficult to come by in the current environment.
As we step back and take a longer-term view of the future, however, the threat of stagflation is becoming more realistic. Coined as a combination of the words “stagnation” and “inflation,” it is an economic backdrop characterized by high inflation, slow economic growth, and in some cases, high unemployment.
In this edition, we examine which asset classes are most exposed to stagflation and which can offer shelter.
Read > Bracing for Stagflation
The opinions expressed herein are those of Marquette Associates, Inc. (“Marquette”), and are subject to change without notice. This material is not financial advice or an offer to purchase or sell any product. Marquette reserves the right to modify its current investment strategies and techniques based on changing market dynamics or client needs.

10.19.2026
Since 1980, the S&P 500 Index has generally performed well in the weeks surrounding U.S. midterm elections. Specifically, the index…

10.12.2026
This week’s chart highlights the accelerating growth of electricity demand in the U.S., which has been driven primarily by the…

10.08.2026
LIVE WEBINAR — OCTOBER 22 Please join Marquette’s research team for our 3Q 2026 Market Insights Webinar…

10.05.2026
For investors, the spookiest thing about October might not be the ghosts and monsters that are bound to show up…

09.28.2026
The phrase “expectations of higher inflation” has become a staple in financial news to explain the increase in nominal U.S….
09.21.2026
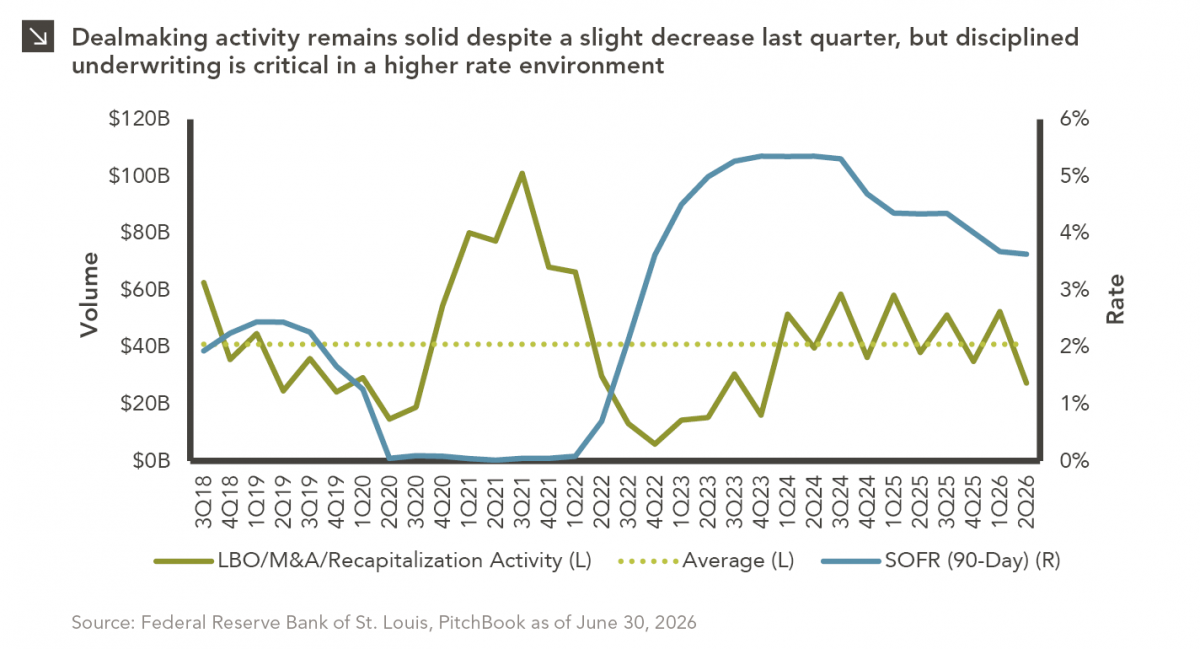
For much of the past several years, the conventional view has been that higher interest rates and stretched valuations would…
Research alerts keep you updated on our latest research publications. Simply enter your contact information, choose the research alerts you would like to receive and click Subscribe. Alerts will be sent as research is published.
We respect your privacy. We will never share or sell your information.
If you have questions or need further information, please contact us directly and we will respond to your inquiry within 24 hours.
Contact Us >