Jesus Jimenez
Partner
This week’s Chart of the Week examines the importance of personal consumer expenditures (PCE) on the U.S. economy. From 1970 to 1st quarter 2013, PCE has grown from 60% to 69% of GDP as the health of the economy has become more dependent on consumers. While many factors can account for the PCE figure, one of the more telling data points is the personal savings rate: if consumers are spending more, they must naturally be saving less. Not surprisingly, the personal savings rate has declined from 12.3% in 1970, indicating a trend of consumers saving less and spending more. Savings rates hit all time lows leading up to the recent recession as consumers spent outside of their means in an overheated economy. In reaction to the economic downturn, consumers became conservative and increased their savings, applying further negative pressure to an already troubled economy. Currently the savings rate has trended back down, a sign that fear has subsided and investors are spending more. This coupled with favorable trends in housing and consumer confidence are positive indicators for future economic growth.

The opinions expressed herein are those of Marquette Associates, Inc. (“Marquette”), and are subject to change without notice. This material is not financial advice or an offer to purchase or sell any product. Marquette reserves the right to modify its current investment strategies and techniques based on changing market dynamics or client needs.
02.17.2026
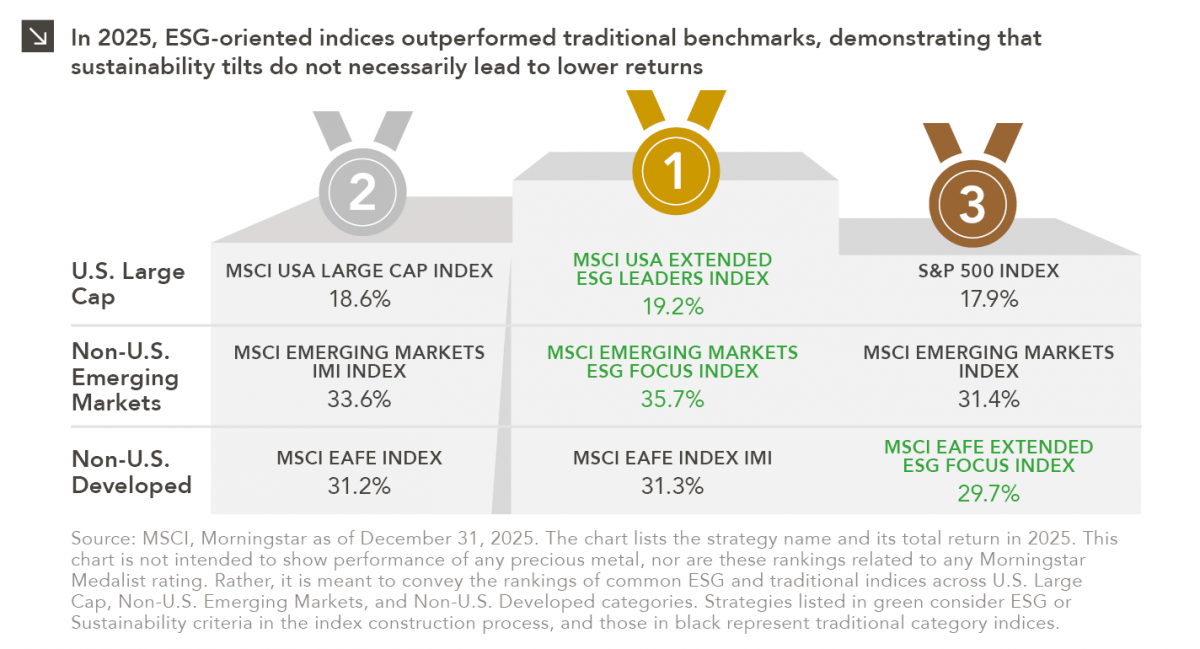
Performance is a key attribute of any investment strategy with a values-based or sustainability focus. As such, analyzing the 2025…

02.09.2026
Precious metals have been going on a magnificent run in recent years. Specifically, gold moved from $1,898/ounce at the end…
02.02.2026
Macroeconomic forecasting is challenging in the best of times and proved downright impossible in 2025, which saw high levels of…
01.26.2026
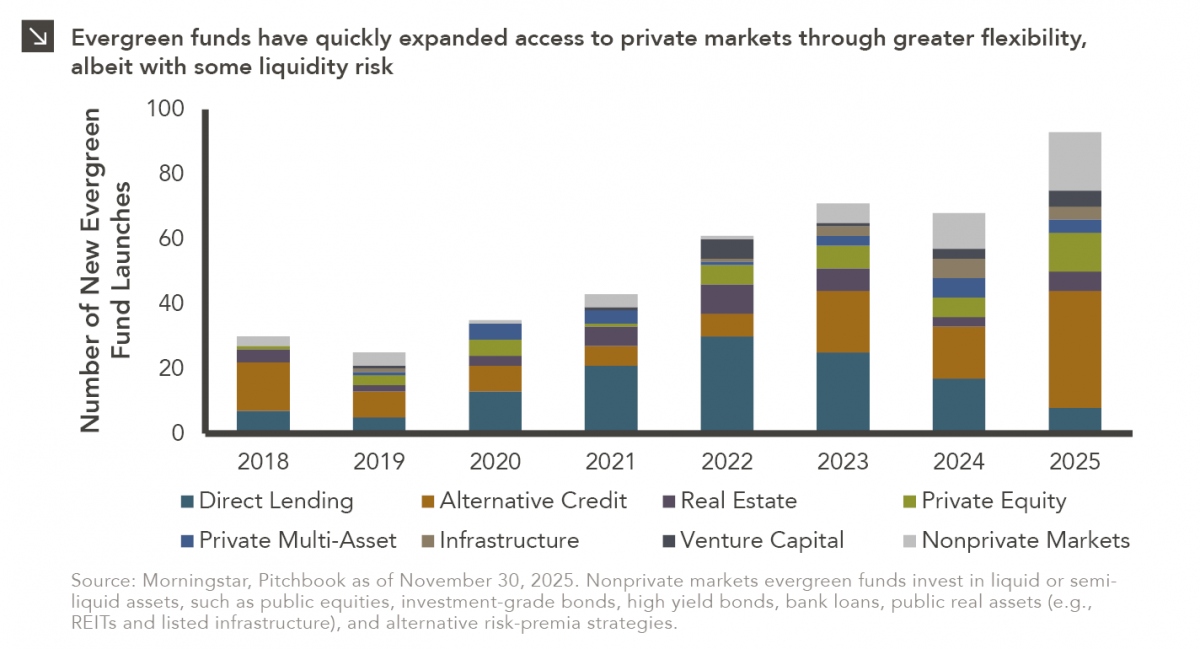
In recent years, access to traditionally illiquid private markets has expanded through the rapid growth of evergreen funds, which provide…
01.22.2026
Anyone who has gone snowmobiling knows it can be simultaneously exhilarating and terrifying. Throttling across snow and through a forest…
01.20.2026
Last week, Alphabet joined NVIDIA, Microsoft and Apple as the only companies to ever reach a market capitalization of $4…
Research alerts keep you updated on our latest research publications. Simply enter your contact information, choose the research alerts you would like to receive and click Subscribe. Alerts will be sent as research is published.
We respect your privacy. We will never share or sell your information.
If you have questions or need further information, please contact us directly and we will respond to your inquiry within 24 hours.
Contact Us >