Frank Valle, CFA, CAIA
Associate Director of Fixed Income


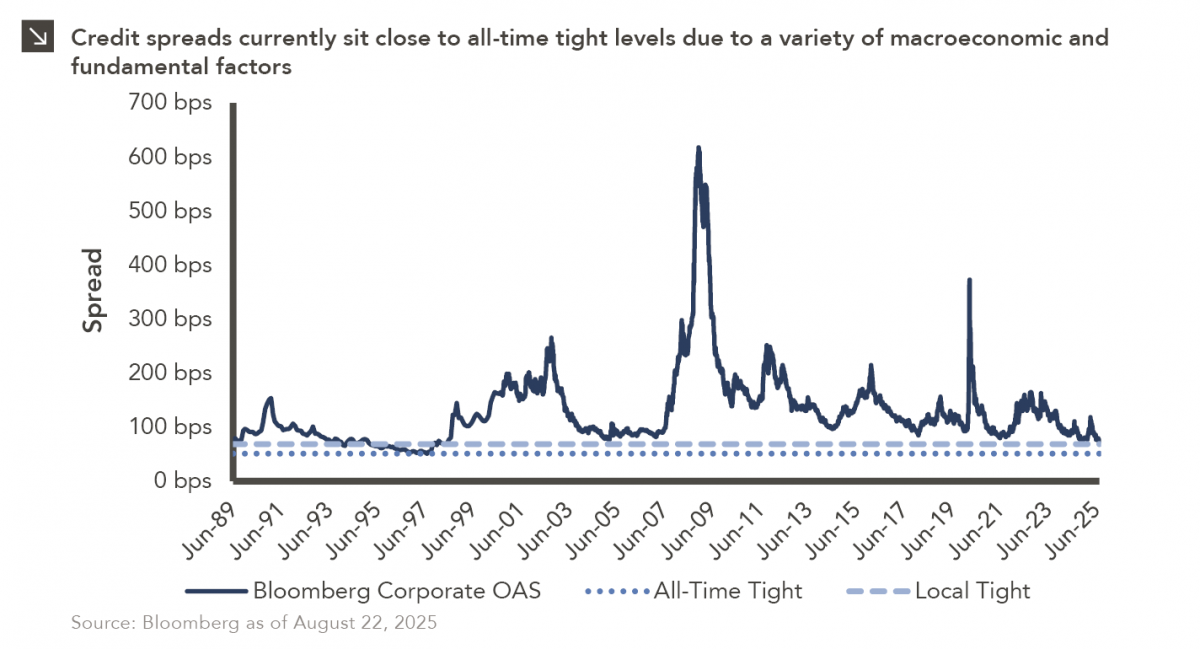
July 31, 1997 is a date which will live in infamy. On this day, FedEx Express Flight 14 crashed at Newark International Airport, baseball slugger Mark McGwire was traded from the Oakland Athletics to the St. Louis Cardinals, and the Lehman Corporate Index hit an all-time tight of 51 basis points. While not quite at all-time tight levels, credit spreads are currently partying like it’s (almost) 1999. Specifically, the Bloomberg Corporate Index, the successor to the Lehman Corporate Index, sat at 75 basis points as of August 22, 2025, the lowest level in more than 25 years. And you may ask yourself: “Well, how did I get here?”
Tight credit spreads generally indicate that investors see less risk in the market relative to government bonds, and current spreads can be examined using a combination of macroeconomic, fundamental, and technical factors. On the macroeconomic front, tariff-related volatility in the first half of 2025 caused spreads to widen, but this widening was followed quickly by a return to lower levels given progress with trade negotiations. Additionally, a strong second quarter GDP figure and moderating inflation have provided a strong backdrop for credit. When it comes to fundamentals, credit also appears healthy. The COVID-19 pandemic gave companies the opportunity to strengthen balance sheets by terming out debt at low interest rates, while corporate earnings remain favorable. With more than 92% of S&P 500 Index constituents reporting, expectations are for EPS growth of roughly 11% for the benchmark in the second quarter (on a year-over-year basis). This figure far exceeds the consensus pre-earnings estimate of 5%. Higher coverage ratios, combined with leverage ratios that have fallen significantly since the Global Financial Crisis, creates a solid fundamental backdrop for credit. Finally, on the more technical side, strong demand for risk assets has stretched valuations, and the correlation between fund inflows and credit spreads is very high. Indeed, as most bond investors are yield buyers, higher base rates have made the fixed income space more attractive, and this dynamic has pushed spreads tighter.
In conclusion, a solid macroeconomic background, strong fundamentals, and technical factors have driven credit spreads to near historic tights. Barring an exogenous market shock, spreads may remain tight in the coming months, meaning investors should exercise caution when it comes to credit given the little room for error conditions currently provide.
Print PDF
The opinions expressed herein are those of Marquette Associates, Inc. (“Marquette”), and are subject to change without notice. This material is not financial advice or an offer to purchase or sell any product. Marquette reserves the right to modify its current investment strategies and techniques based on changing market dynamics or client needs.

10.19.2026
Since 1980, the S&P 500 Index has generally performed well in the weeks surrounding U.S. midterm elections. Specifically, the index…

10.12.2026
This week’s chart highlights the accelerating growth of electricity demand in the U.S., which has been driven primarily by the…

10.08.2026
LIVE WEBINAR — OCTOBER 22 Please join Marquette’s research team for our 3Q 2026 Market Insights Webinar…

10.05.2026
For investors, the spookiest thing about October might not be the ghosts and monsters that are bound to show up…

09.28.2026
The phrase “expectations of higher inflation” has become a staple in financial news to explain the increase in nominal U.S….

09.21.2026
For much of the past several years, the conventional view has been that higher interest rates and stretched valuations would…
Research alerts keep you updated on our latest research publications. Simply enter your contact information, choose the research alerts you would like to receive and click Subscribe. Alerts will be sent as research is published.
We respect your privacy. We will never share or sell your information.
If you have questions or need further information, please contact us directly and we will respond to your inquiry within 24 hours.
Contact Us >