Christopher Caparelli, CFA
Partner
Last week’s chart addressed the increase in IPOs during 2011. In addition to the number of companies coming to market, the returns of these companies post-offering can also serve as an important metric. So far in 2011, stocks that have been public for less than one year, as measured by the Bloomberg IPO index, have returned a positive 4.1%, yet are lagging behind the broad Russell 3000 index which is up 6.7% for the year. While the returns of newly listed companies are often linked to the general direction of the market in which they trade, severe dislocations like the occurrence in 1999 are cause for concern. Although there is some concern about the rapid price increase witnessed for some of the IPOs in 2011, we are still far from the misplaced exuberance of 1999.

The opinions expressed herein are those of Marquette Associates, Inc. (“Marquette”), and are subject to change without notice. This material is not financial advice or an offer to purchase or sell any product. Marquette reserves the right to modify its current investment strategies and techniques based on changing market dynamics or client needs.

04.02.2026
Please join Marquette’s research team for our 1Q 2026 Market Insights Webinar analyzing the first quarter across the economy and various…
03.30.2026
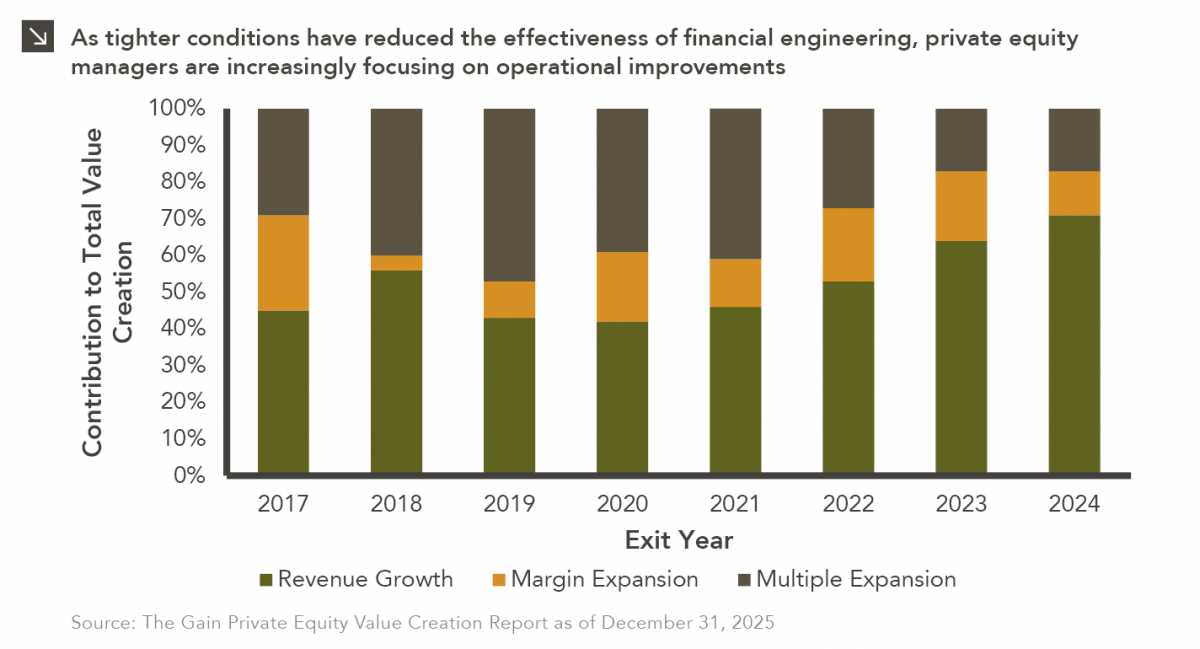
In the period between 2009 and 2022, private equity managers thrived amid an environment of low interest rates and rising…

03.23.2026
Global energy costs have risen sharply this month due to a convergence of geopolitical shocks, as critical infrastructure and transport…

03.16.2026
This week’s chart illustrates a clear structural shift in the fundraising dynamics of North American closed-end real estate funds over…

03.09.2026
Warren Buffett once implored investors to “be greedy when others are fearful,” and this sage advice is certainly applicable to…

03.02.2026
Recent market dynamics in the software sector reflect a sharp shift in investor sentiment driven primarily by concerns that advances…
Research alerts keep you updated on our latest research publications. Simply enter your contact information, choose the research alerts you would like to receive and click Subscribe. Alerts will be sent as research is published.
We respect your privacy. We will never share or sell your information.
If you have questions or need further information, please contact us directly and we will respond to your inquiry within 24 hours.
Contact Us >