03.23.2026
Pain at the Pump
Global energy costs have risen sharply this month due to a convergence of geopolitical shocks, as critical infrastructure and transport…
Homeownership has historically been part of the American dream; however, recent data trends show that more consumers are postponing or bypassing this life event in favor of renting. The sting of the Great Recession still resides within consumers’ minds, many of whom are still struggling from a period in which millions of homes went into foreclosure and trillions of dollars of home equity was wiped out. While the devastating housing crash is certainly one culprit, a shift in millennials’ attitudes could also be contributing to this change in sentiment.
In this week’s chart, we examine the declining rate of homeownership versus the increasing costs of renting. Despite the attractive level of home affordability, homeownership is at its lowest level in 29 years and monthly rents are at an all-time high. In ten short years, the percentage of non-vacant housing units occupied by the unit’s owner has declined from its 2005 peak of 69.1% to just 63.7% this year. Meanwhile, the median monthly asking rent has risen 31.4% during the same period. The U.S. Census Bureau reported that the most recent median asking sales price was $149,500, the same nominal levels we were seeing in the latter part of 2005 but significantly lower than the 2Q 2007 peak of $201,500.
While the U.S. economy has made great strides in its economic recovery, the housing market has yet to come out of its shell. The impact of increased home purchase activity and its resulting consumption effect would be a boon to the domestic economy. Thirty-year mortgage notes can still be obtained for less than four percent interest, but the availability of cheap credit has not been enough to drive more millennials into homeownership. As we debate the impacts of tightened monetary policy by the Federal Reserve, the consequences of rising interest rates and its direct effect on the housing market cannot be ignored.
The opinions expressed herein are those of Marquette Associates, Inc. (“Marquette”), and are subject to change without notice. This material is not financial advice or an offer to purchase or sell any product. Marquette reserves the right to modify its current investment strategies and techniques based on changing market dynamics or client needs.

03.23.2026
Global energy costs have risen sharply this month due to a convergence of geopolitical shocks, as critical infrastructure and transport…

03.16.2026
This week’s chart illustrates a clear structural shift in the fundraising dynamics of North American closed-end real estate funds over…

03.09.2026
Warren Buffett once implored investors to “be greedy when others are fearful,” and this sage advice is certainly applicable to…

03.02.2026
Recent market dynamics in the software sector reflect a sharp shift in investor sentiment driven primarily by concerns that advances…

02.23.2026
Most have traditionally viewed a successful exit for a venture-backed start-up as either an IPO or an acquisition by a…
02.17.2026
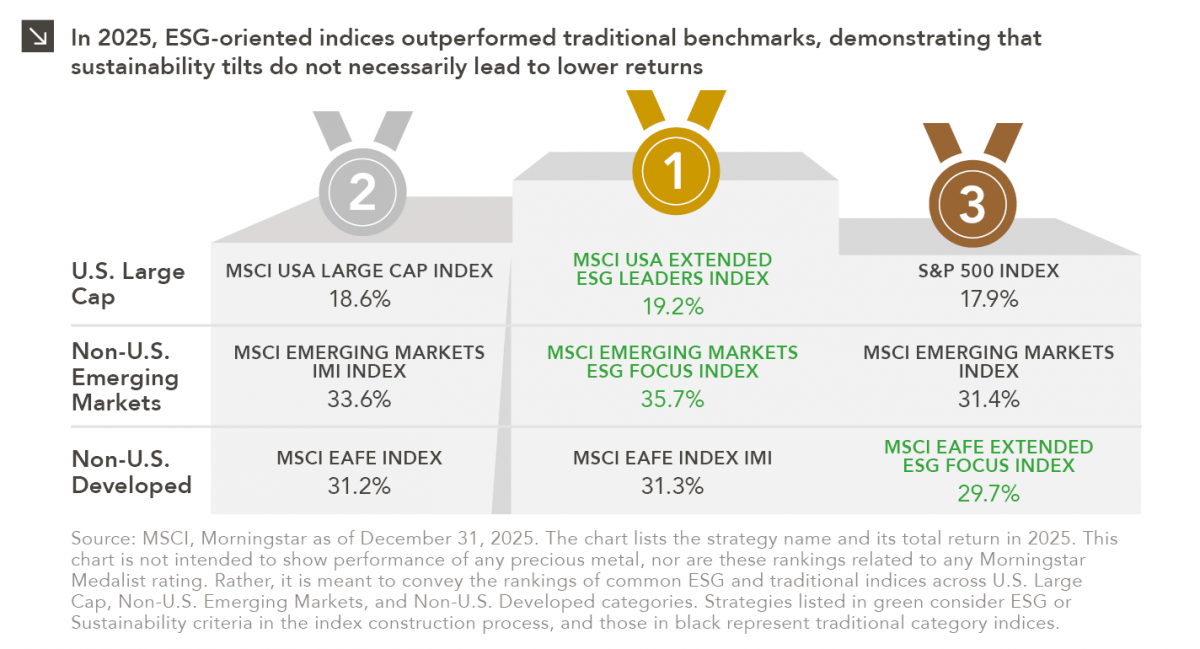
Performance is a key attribute of any investment strategy with a values-based or sustainability focus. As such, analyzing the 2025…
Research alerts keep you updated on our latest research publications. Simply enter your contact information, choose the research alerts you would like to receive and click Subscribe. Alerts will be sent as research is published.
We respect your privacy. We will never share or sell your information.
If you have questions or need further information, please contact us directly and we will respond to your inquiry within 24 hours.
Contact Us >