Rising Stars are a Bright Spot in 2022

November 16, 2022 | Eddie Arrieta, Associate Research Analyst

Two-column chart numbers of rising stars and fallen angels yearly. Chart subtitle: The number of rising stars has outweighed the number of fallen angels so far this year. Chart visual description: X-axis years begin in 2011 and continue annualy through 2022 YTD (November 2022). Y-axis ranges 0 to 60. Each year has a column for rising stars in light blue and a column for fallen angels in dark teal. Chart data description: In 2022 YTD category, both columns match 2021’s counts, with 26 rising angels and 10 fallen angels. 2020 represented a peak for the period shown in fallen angels, with 51. Peak for rising stars was in 2014 at 39. For all years shown except 2016, 2017, and 2020, there were more rising stars than fallen angels. Chart source: J.P. Morgan, Moody’s Investors Service, S&P as of November 4, 2022. End chart description. See disclosures at end of document.

While 2022 has been an exceptionally challenging year, with both equities and fixed income down meaningfully, there are a few bright spots within the high yield space. The number of rising stars, which are below investment grade securities (high yield) that have been upgraded to an investment grade rating, has already hit 2021 levels with two months remaining in the year. Fallen angel securities — previously investment grade businesses that have fallen to high yield or “junk bond” status — remain relatively low. The increase in rising stars over the last two years comes after a big increase in fallen angels in 2020, and has been driven in part by a recovery in economic activity following the pandemic and better financial discipline of management teams. Many companies used the period of incredibly low interest rates to shore up balance sheets and push out debt maturities. A company’s credit rating changing from high yield to investment grade is significant, especially when facing a slowdown, as it allows the company to better access funding in the capital markets. The number of rising stars is a good trend in credit and quality overall in high yield has improved. Paired with the most attractive yields in years, the forward outlook looks promising in credit.

Print PDF > Rising Stars are a Bright Spot in 2022


The opinions expressed herein are those of Marquette Associates, Inc. (“Marquette”), and are subject to change without notice. This material is not financial advice or an offer to purchase or sell any product. Marquette reserves the right to modify its current investment strategies and techniques based on changing market dynamics or client needs.

Eddie Arrieta
Associate Research Analyst

Get to Know Eddie

The opinions expressed herein are those of Marquette Associates, Inc. (“Marquette”), and are subject to change without notice. This material is not financial advice or an offer to purchase or sell any product. Marquette reserves the right to modify its current investment strategies and techniques based on changing market dynamics or client needs.

Related Content

04.01.2026

A Portfolio Needs Structure: An Overview of the Securitized Credit Asset Class

Fixed income is the largest global financial market and often one of the largest allocations within institutional investors’ portfolios. A…

Stacked column chart comparing contribution to total value creation broken out by revenue growth, margin expansion, and multiple expansion for private equity managers, by exit year, 2017 to 2024. 2017 column 45% revenue growth, 26% margin expansion, 29% multiple expansion. 2018 column 56% revenue growth, 4% margin expansion, 40% multiple expansion. 2019 column 43% revenue growth, 10% margin expansion, 47% multiple expansion. 2020 column 42% revenue growth, 19% margin expansion, 39% multiple expansion. 2021 column 46% revenue growth, 13% margin expansion, 42% multiple expansion. 2022 column 53% revenue growth, 20% margin expansion, 27% multiple expansion. 2023 column 64% revenue growth, 19% margin expansion, 17% multiple expansion. 2024 column 71% revenue growth, 12% margin expansion, 17% multiple expansion.

03.30.2026

Pulling the Right Value Creation Levers

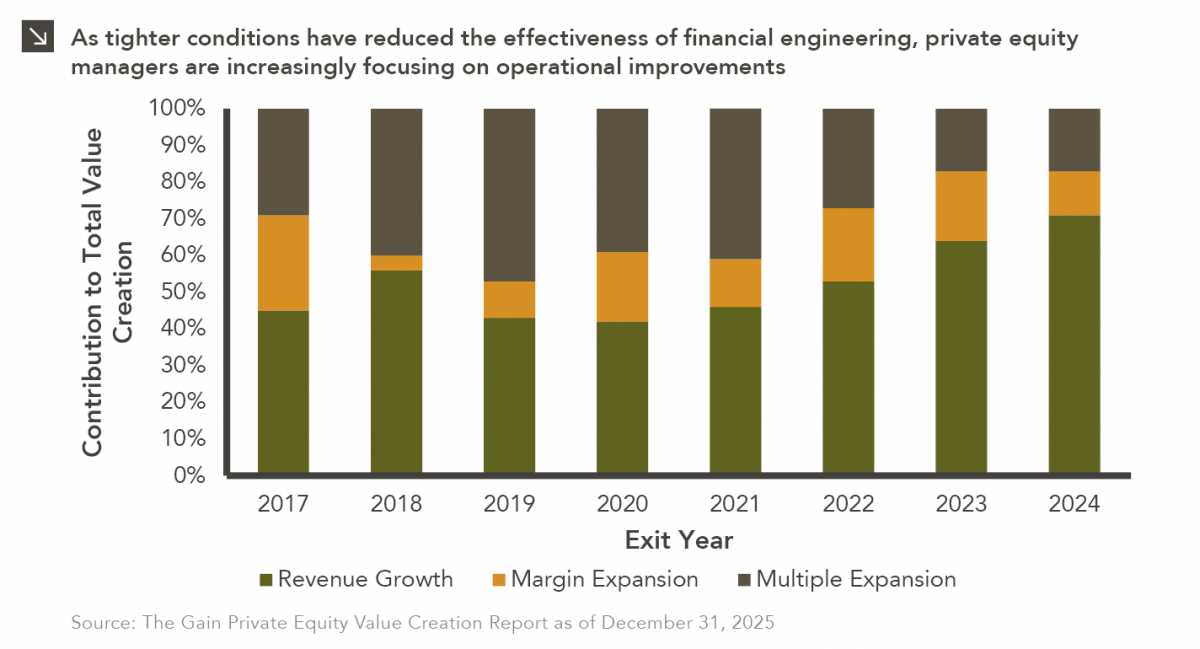
In the period between 2009 and 2022, private equity managers thrived amid an environment of low interest rates and rising…

Line chart comparing Brent Crude Futures, WTI Futures, and European Gas Futures from December 2023 to present. Lefthand y-axis labeled Price per Barrel and ranges $0 to $120, corresponding to Brent Crude and WTI data series. Righthand y-axis labeled Price per megawatt Hour and ranges €0 to €70, corresponding to Euro-pean Gas Futures. All three series have spiked in recent weeks, with most recent data as of March 23, 2026 at 100.49 for Brent Crude, 88.72 for WTI, and 54.69 for European gas. Dashed line overlay at February 28 highlighting strikes on Iran.

03.23.2026

Pain at the Pump

Global energy costs have risen sharply this month due to a convergence of geopolitical shocks, as critical infrastructure and transport…

Column chart showing months from first to final close for North American Closed-End Real Estate Funds with average (~10.6 months) overlaid using dotted line. Up to 2020, funds generally stayed below 10 months; in the years since, it is well over, with 2025 at 25 months.

03.16.2026

Closing Time

This week’s chart illustrates a clear structural shift in the fundraising dynamics of North American closed-end real estate funds over…

03.09.2026

Buy High, Sell Low?

Warren Buffett once implored investors to “be greedy when others are fearful,” and this sage advice is certainly applicable to…

Line chart compares credit/equity index performance since January 2025. Please contact us for full data details.

03.02.2026

A Bug in the Software

Recent market dynamics in the software sector reflect a sharp shift in investor sentiment driven primarily by concerns that advances…

More articles

Subscribe to Research Email Alerts

Research Email Alert Subscription

Research alerts keep you updated on our latest research publications. Simply enter your contact information, choose the research alerts you would like to receive and click Subscribe. Alerts will be sent as research is published.

We respect your privacy. We will never share or sell your information.

Thank You

We appreciate your interest in Marquette Associates.

If you have questions or need further information, please contact us directly and we will respond to your inquiry within 24 hours.

Contact Us >