Mike Spychalski, CAIA
Vice President
This weeks’ Chart of the Week looks at the state of the service sector in the U.S., as measured by the Institute for Supply Management (ISM) Non-Manufacturing Index. On August 5th, the ISM released July data for the ISM Non-Manufacturing Index, which posted a reading of 58.7 (a reading greater than 50 indicates expansion in the service sector while a reading below 50 indicates contraction). This was the highest reading since December 2005 and is one of the highest on record for the index (which dates back to July 1997). This index is important because it serves as a gauge of the overall strength of the service sector of the U.S. economy, and considering that the service sector is the single largest component of U.S. GDP (representing 45.7% of GDP as of 2Q 2014), it has fairly significant implications for the broad economy.
A deeper look into the underlying constituents of the ISM Non-Manufacturing Index points to continuing strength in the service sector. The new orders component, which reflects the level of new orders from customers, posted a reading of 64.9 in July. This was the highest reading of the new orders index since August 2005 and is also one of the highest on record. The employment component of the Non-Manufacturing Index also showed strength in July, posting a reading of 56.0. This was higher than the 54.4 reading in June but it is still lagging the broad Non-Manufacturing index. Given that the new orders index has increased significantly from 50.4 in December 2013 to 64.9 in July, we could see significant growth in service sector employment during the second half of the year if companies start to hire additional employees in order to keep pace with the increased demand.

The opinions expressed herein are those of Marquette Associates, Inc. (“Marquette”), and are subject to change without notice. This material is not financial advice or an offer to purchase or sell any product. Marquette reserves the right to modify its current investment strategies and techniques based on changing market dynamics or client needs.

02.23.2026
Most have traditionally viewed a successful exit for a venture-backed start-up as either an IPO or an acquisition by a…
02.18.2026
Healthcare systems have faced an onslaught of challenges in recent years. They had to navigate the operational and financial headwinds…
02.17.2026
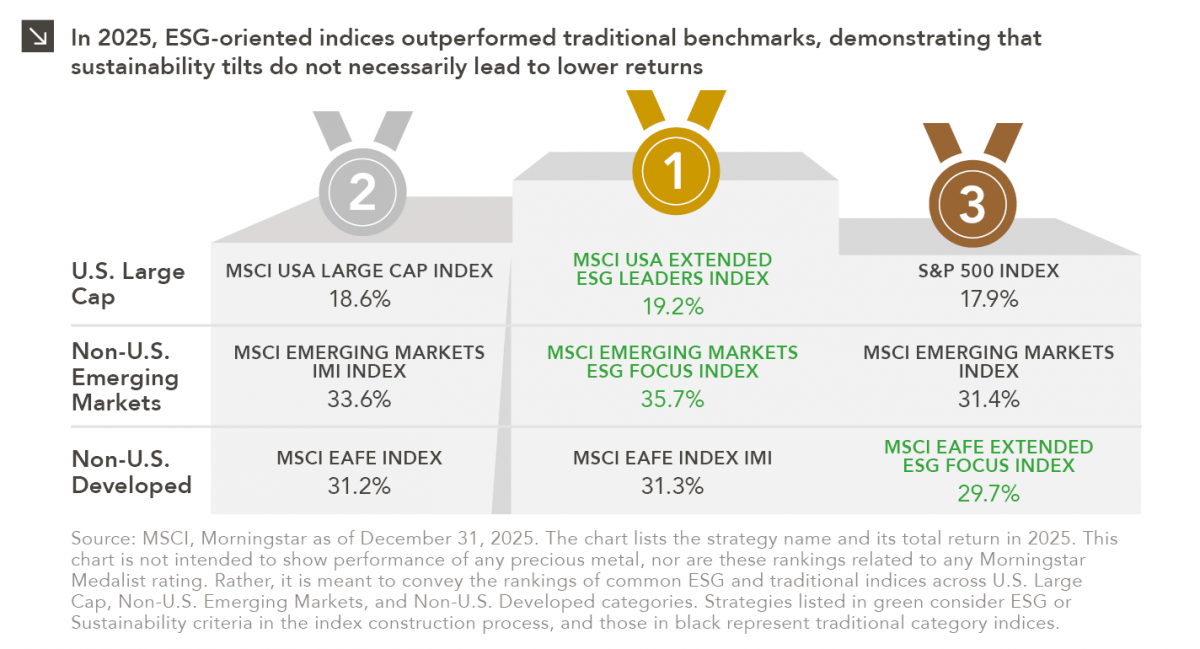
Performance is a key attribute of any investment strategy with a values-based or sustainability focus. As such, analyzing the 2025…

02.09.2026
Precious metals have been going on a magnificent run in recent years. Specifically, gold moved from $1,898/ounce at the end…
02.02.2026
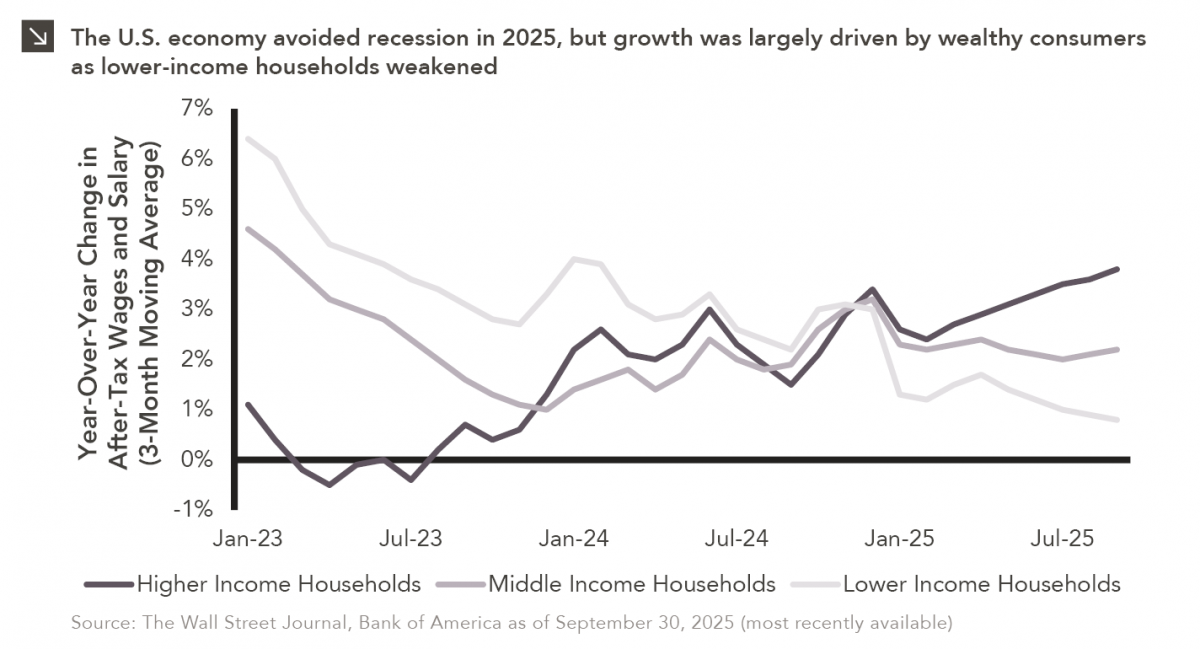
Macroeconomic forecasting is challenging in the best of times and proved downright impossible in 2025, which saw high levels of…
01.26.2026
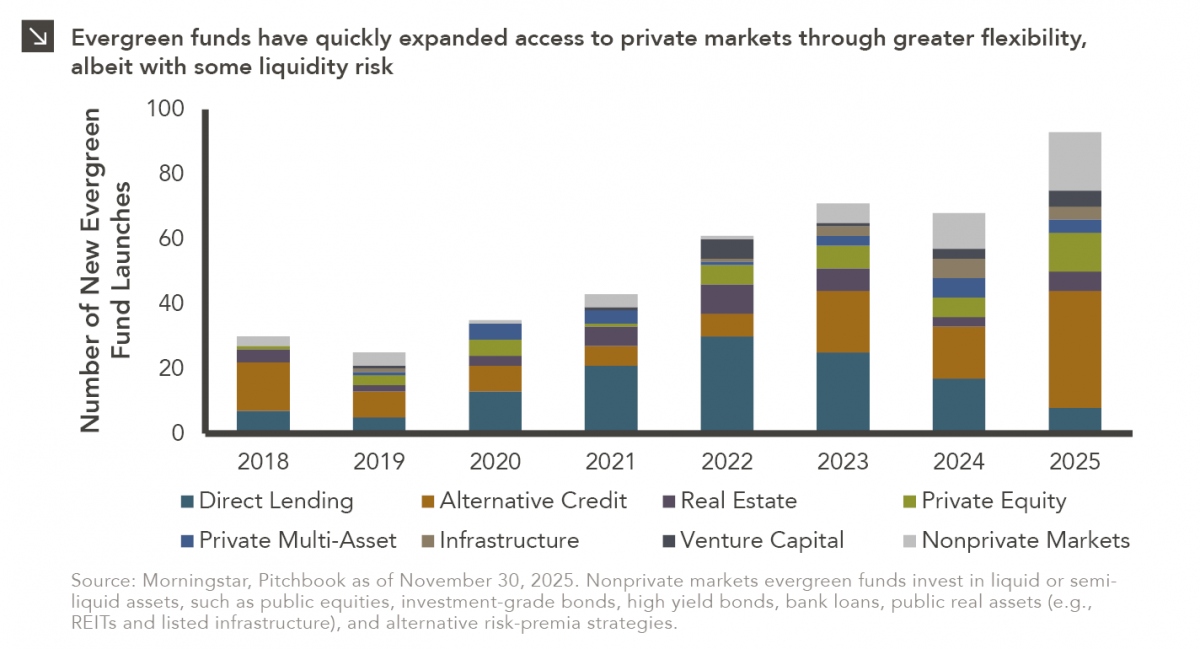
In recent years, access to traditionally illiquid private markets has expanded through the rapid growth of evergreen funds, which provide…
Research alerts keep you updated on our latest research publications. Simply enter your contact information, choose the research alerts you would like to receive and click Subscribe. Alerts will be sent as research is published.
We respect your privacy. We will never share or sell your information.
If you have questions or need further information, please contact us directly and we will respond to your inquiry within 24 hours.
Contact Us >