10.22.2025
3Q 2025 Market Insights
This video is a recording of a live webinar held October 22 by Marquette’s research team analyzing the third quarter…

Our Chart of the Week examines the concentration in market cap over time among the five largest stocks in the S&P 500 relative to the total market cap of the index. With growth outperforming value in the current market cycle, it’s not surprising to see the largest stocks by market cap today populated entirely by growth stocks. The strong performance among FAANG stocks (Facebook, Apple, Amazon, Netflix, and Google/Alphabet) have propelled the weighting of these securities within market cap weighted indices over recent years and caused market participants to question how long this historic run can last and if we are currently in a technology sector bubble. With names such as Facebook and Netflix pulling back earlier in the year and Apple hitting a $1 trillion market cap milestone last week, fears of a technology bubble have only continued.
As of June 2018, the largest five stocks in the S&P 500 occupied 15.9% of the total market cap of the index. This concentration is high relative to the current market cycle, but it is important to note that we are still below the March 2000 high of 18.5%. Additionally, the largest five stocks in the S&P 500 have occupied greater than 20% of the total S&P 500 market cap in prior periods such as during the 1970’s.
The technology sector does trade at a premium to the broader market today. However, the sector generates high return on equity, strong earnings growth, and multiple expansion is not as excessive as during the dot-com peak. While the recent rise in technology stock weighting as a percentage of total market cap warrants monitoring, today’s concentration is not without precedence.
The opinions expressed herein are those of Marquette Associates, Inc. (“Marquette”), and are subject to change without notice. This material is not financial advice or an offer to purchase or sell any product. Marquette reserves the right to modify its current investment strategies and techniques based on changing market dynamics or client needs.
The opinions expressed herein are those of Marquette Associates, Inc. (“Marquette”), and are subject to change without notice. This material is not financial advice or an offer to purchase or sell any product. Marquette reserves the right to modify its current investment strategies and techniques based on changing market dynamics or client needs.

10.22.2025
This video is a recording of a live webinar held October 22 by Marquette’s research team analyzing the third quarter…
10.22.2025
I spent the past weekend at my alma mater to watch them play their biggest rival. Football weekends there are…
10.20.2025
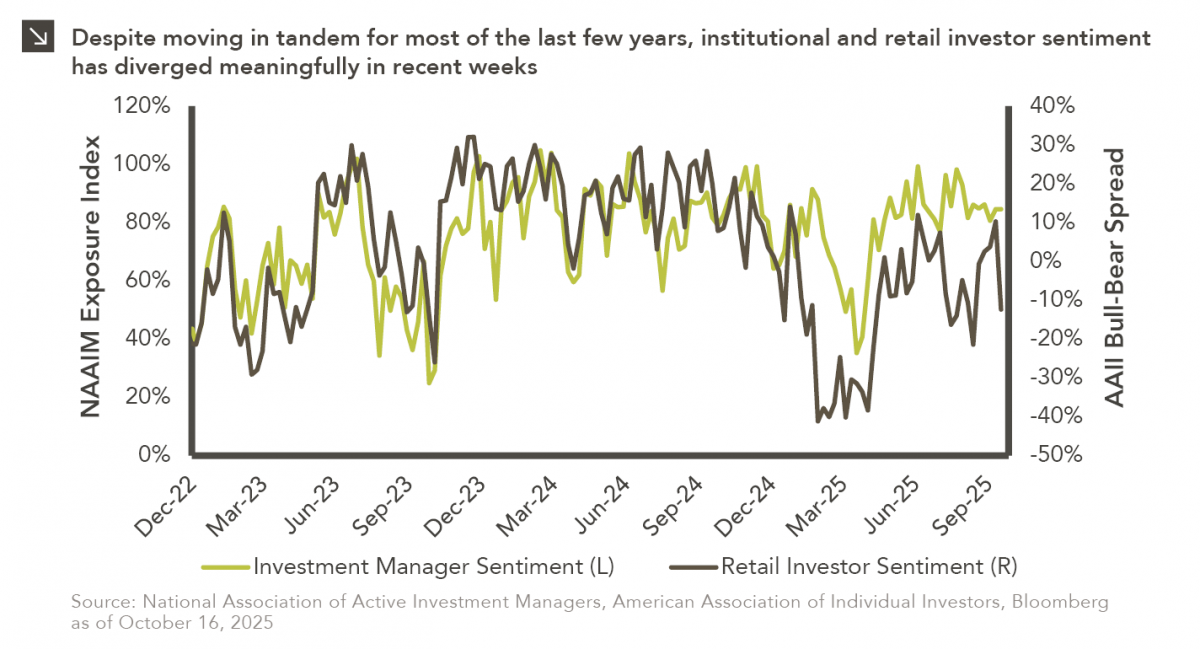
This week’s chart compares institutional and retail investor sentiment using two established indicators. Institutional sentiment is represented by the National…
10.13.2025
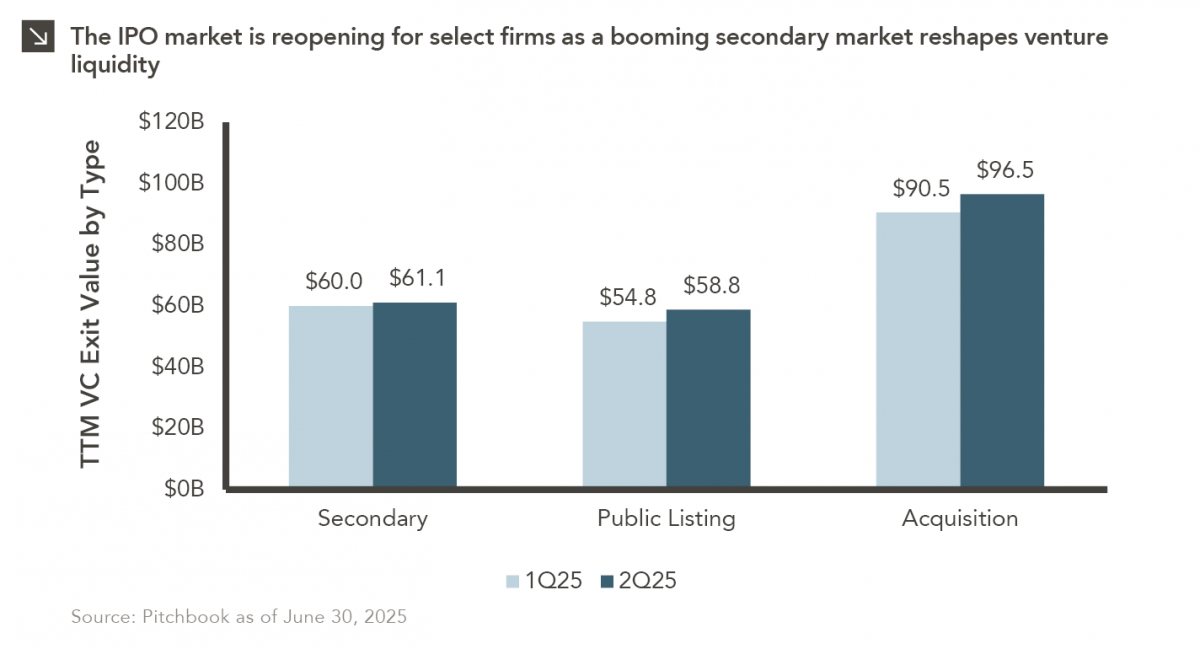
After a three-year drought, the IPO market is stirring again… but only for a select few. Just 18 companies have…
10.06.2025
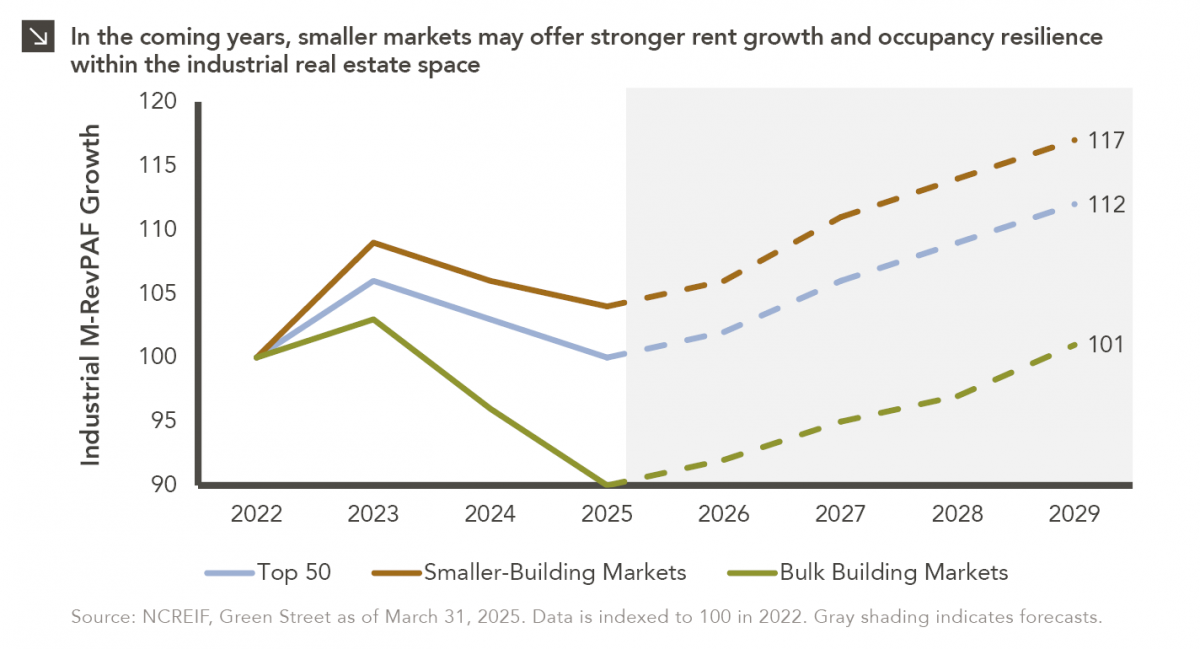
This week’s chart compares realized and expected Market Revenue per Available Foot (“M-RevPAF”) growth within the industrial real estate space…

10.03.2025
Watch the flash talks from Marquette’s 2025 Investment Symposium livestream on September 26 in the player below — use the…
Research alerts keep you updated on our latest research publications. Simply enter your contact information, choose the research alerts you would like to receive and click Subscribe. Alerts will be sent as research is published.
We respect your privacy. We will never share or sell your information.
If you have questions or need further information, please contact us directly and we will respond to your inquiry within 24 hours.
Contact Us >