Jessica Noviskis, CFA
Portfolio Strategist, OCIO Services

“The lumber experience,” as coined by Federal Reserve Chair Jerome Powell, has become the poster child for transient inflation. After a brief pullback during the early days of COVID, lumber prices moved up sharply in 2020 to an unprecedented peak in May 2021. In the two months since, prices have been cut in half to roughly $790 per thousand board feet. While still nearly double pre-pandemic levels, the move is clearly meaningful.
Lumber embodies the different moving pieces of the inflation debate, impacted by easy monetary policy, fiscal stimulus, pandemic-related supply chain issues, and evolving consumer preferences spurred by COVID. Lumber, like other commodities, is priced based on the balance between supply and demand. The lumber market had initially braced for a COVID-related housing pullback that never came. Instead, increasing housing and renovation demand, fueled by record-low interest rates, extra cash, and newfound time at home, combined with restricted supply amid pandemic-related shutdowns led to a more than 250% increase in prices. Then, supply and demand adjusted. Sawmills ramped production and consumers put off purchases. Homebuilding permits fell to a seven-month low. This change in behavior is counter to conditions typical of runaway inflation and should help ease the worst of those concerns.
While it is unlikely lumber falls back to pre-pandemic levels given the severe housing shortage in the U.S., the correction, along with that in other commodities like copper, soybeans, and corn, does help the Fed navigate the thin line between fostering economic growth and managing inflation. In June, the Fed indicated we could see rate hikes start in 2023, up from previous expectations of 2024, though some analysts think this will be pulled forward again into 2022. The path of rates is important to markets — as we saw with the rate increases in 2018 and the rise in the 10-year earlier this year — and we will continue to look to leading indicators, like lumber prices in this case, to help inform our outlook and client recommendations.
Print PDF > The Lumber Experience

The opinions expressed herein are those of Marquette Associates, Inc. (“Marquette”), and are subject to change without notice. This material is not financial advice or an offer to purchase or sell any product. Marquette reserves the right to modify its current investment strategies and techniques based on changing market dynamics or client needs.
02.17.2026
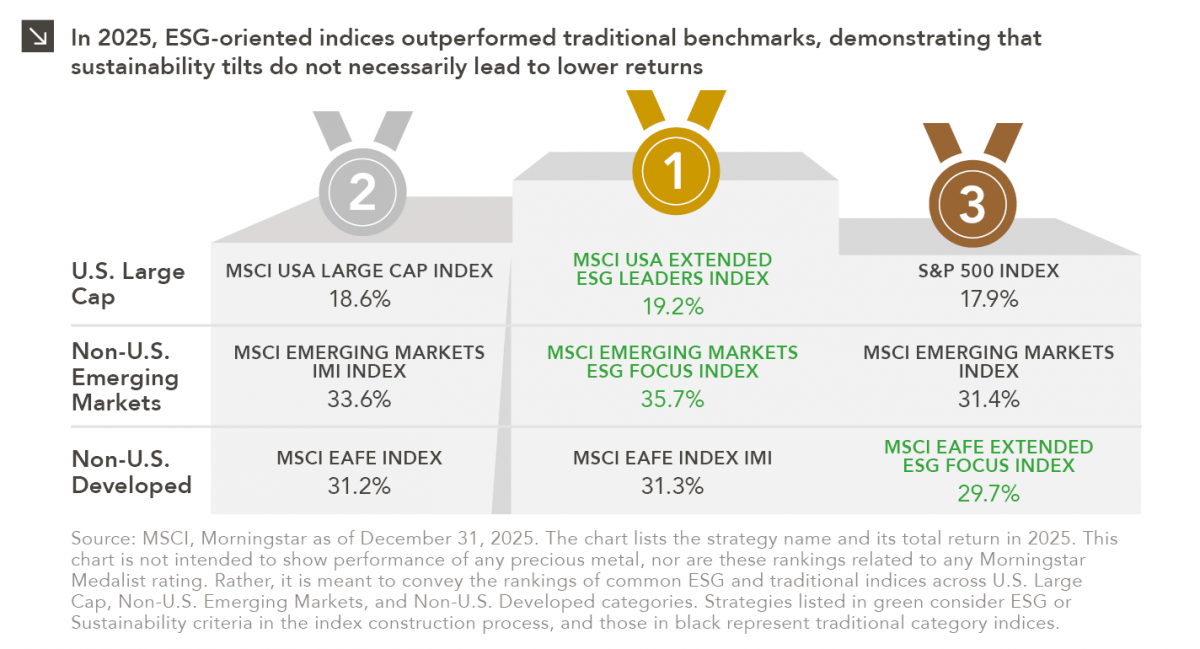
Performance is a key attribute of any investment strategy with a values-based or sustainability focus. As such, analyzing the 2025…

02.09.2026
Precious metals have been going on a magnificent run in recent years. Specifically, gold moved from $1,898/ounce at the end…
02.02.2026
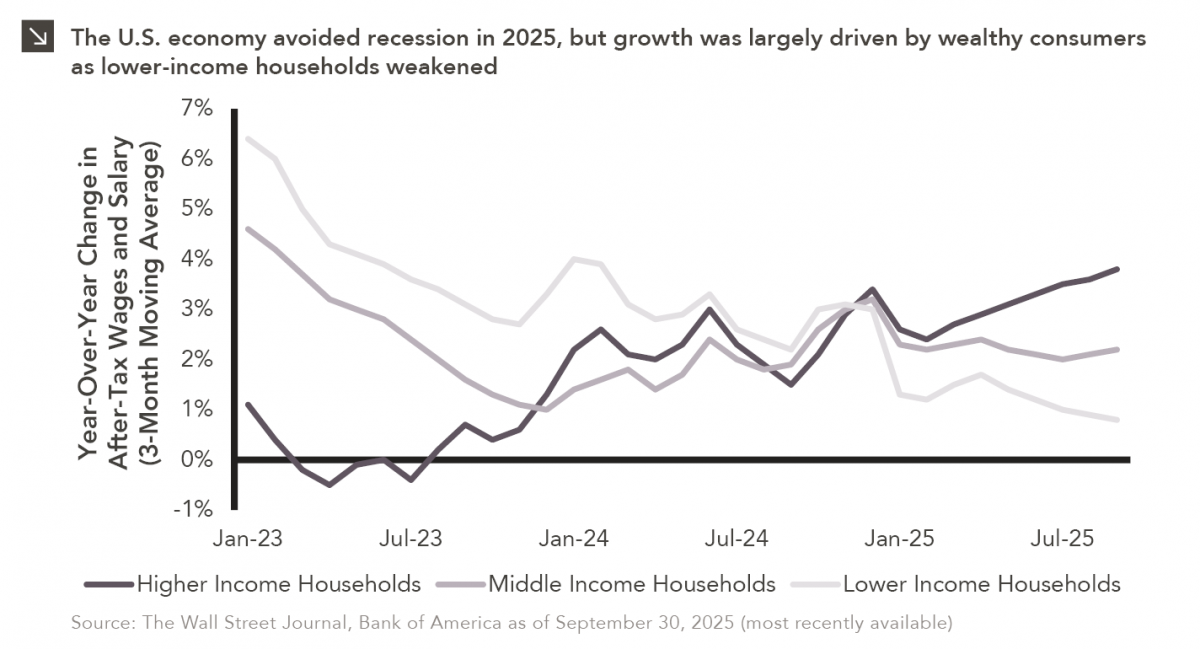
Macroeconomic forecasting is challenging in the best of times and proved downright impossible in 2025, which saw high levels of…
01.26.2026
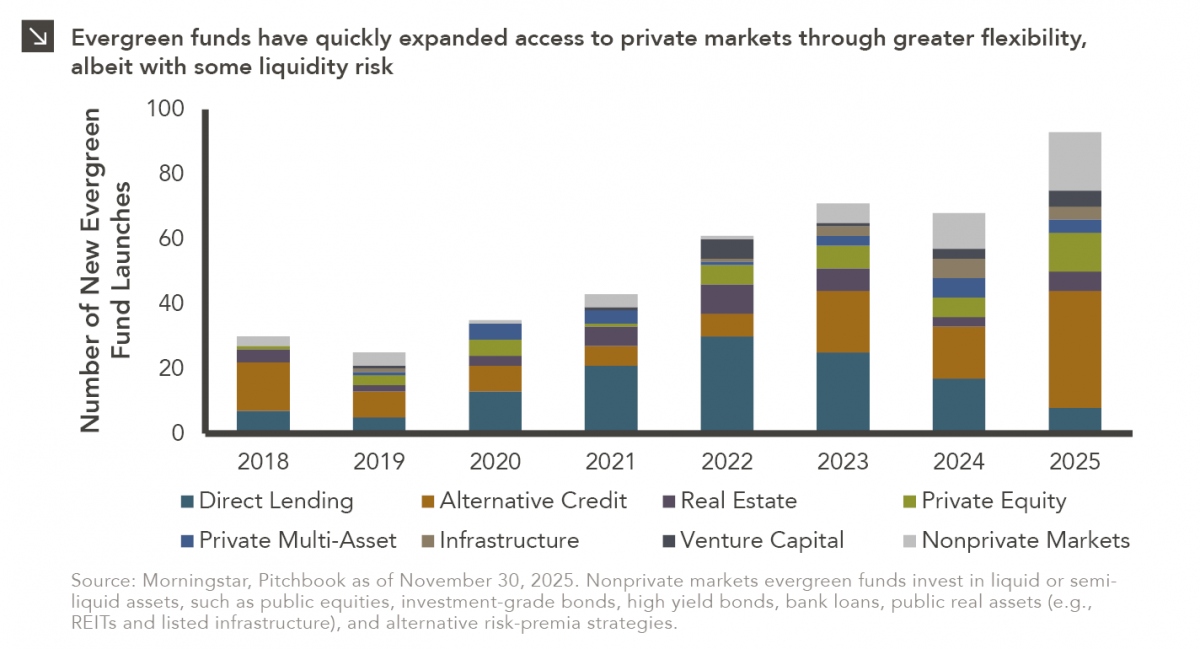
In recent years, access to traditionally illiquid private markets has expanded through the rapid growth of evergreen funds, which provide…
01.22.2026
Anyone who has gone snowmobiling knows it can be simultaneously exhilarating and terrifying. Throttling across snow and through a forest…
01.20.2026
Last week, Alphabet joined NVIDIA, Microsoft and Apple as the only companies to ever reach a market capitalization of $4…
Research alerts keep you updated on our latest research publications. Simply enter your contact information, choose the research alerts you would like to receive and click Subscribe. Alerts will be sent as research is published.
We respect your privacy. We will never share or sell your information.
If you have questions or need further information, please contact us directly and we will respond to your inquiry within 24 hours.
Contact Us >