Jessica Noviskis, CFA
Portfolio Strategist, OCIO Services

Though it has so far taken somewhat of a backseat to the COVID-19 pandemic and global protests for racial justice, 2020 is a U.S. presidential election year. As can be seen in the chart, over the last year and the last several months in particular, the S&P 500 has generally moved in line with expectations for Trump’s reelection this November.¹ As the complicated debate over whether the stock market performs better under a Republican or Democratic president continues, the historical numbers show that the market does notably better in an election year when a Republican wins the seat. While there are always many moving pieces, this makes sense, as Republicans are often considered more pro-business and pro-market than Democrats.
Now into June, that correlation has completely reversed. The S&P 500 has continued its recovery, getting back to flat on the year before last Thursday’s correction, while chances of a 2020 Republican victory have hit new lows. Though based on only two weeks of data — and with another almost five months until the election — it is an interesting departure from historical trends. Voters certainly have a lot to grapple with over the next several months and we will continue to follow all developments closely as history is made.
Print PDF > The Stock Market vs. Trump
¹As measured by data from political betting site PredictIt: “Which party will win the 2020 U.S. presidential election?”

The opinions expressed herein are those of Marquette Associates, Inc. (“Marquette”), and are subject to change without notice. This material is not financial advice or an offer to purchase or sell any product. Marquette reserves the right to modify its current investment strategies and techniques based on changing market dynamics or client needs.
01.26.2026
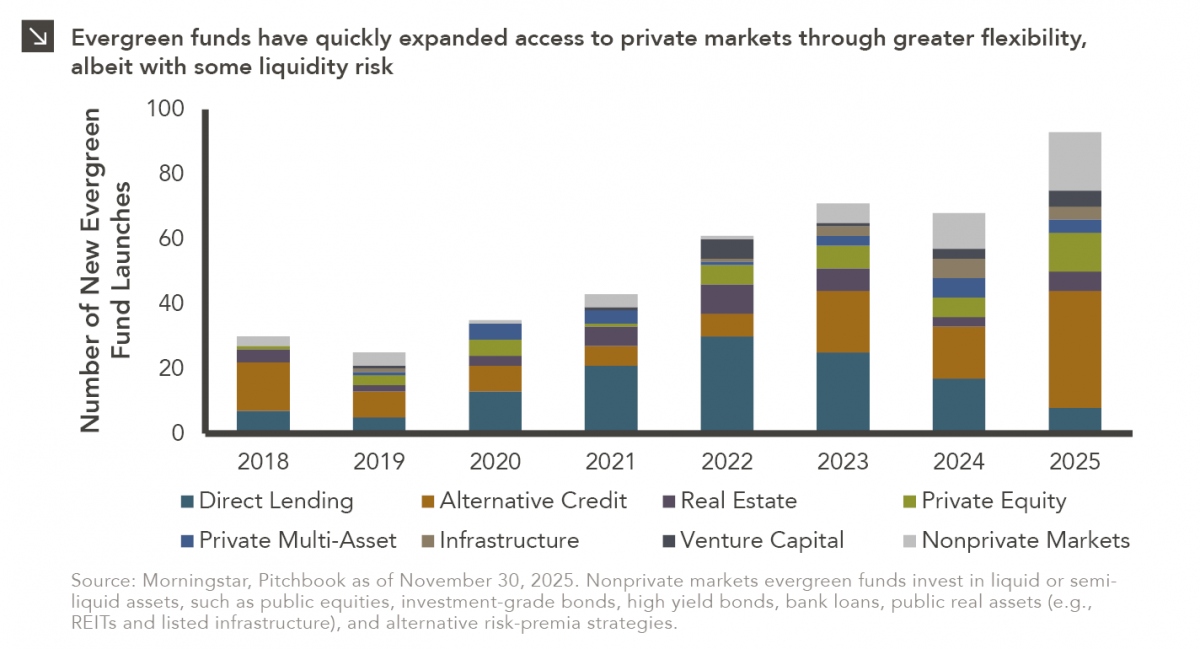
In recent years, access to traditionally illiquid private markets has expanded through the rapid growth of evergreen funds, which provide…
01.22.2026
Anyone who has gone snowmobiling knows it can be simultaneously exhilarating and terrifying. Throttling across snow and through a forest…
01.20.2026
Last week, Alphabet joined NVIDIA, Microsoft and Apple as the only companies to ever reach a market capitalization of $4…

01.07.2026
This video is a recording of a live webinar held January 15 by Marquette’s research team analyzing 2025 across the…
01.12.2026
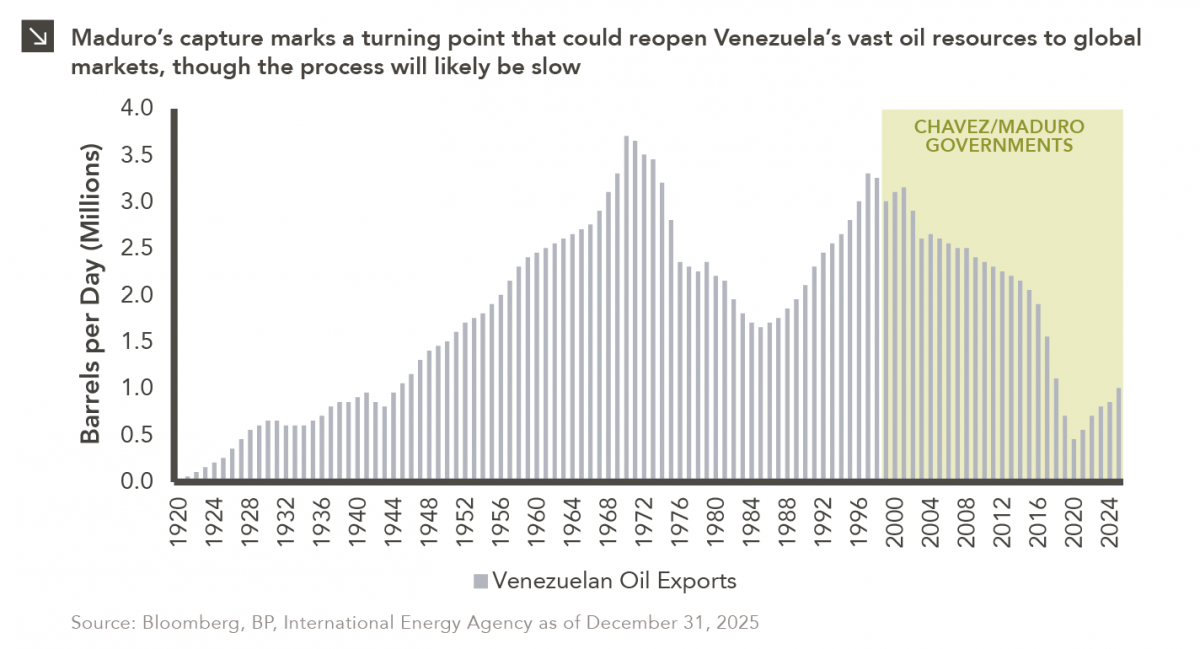
The capture of Venezuelan president Nicolás Maduro is a watershed moment for a country whose natural resource economy has been…

01.05.2026
The development of artificial intelligence is advancing along two largely distinct paths. The first centers on generative AI powered by…
Research alerts keep you updated on our latest research publications. Simply enter your contact information, choose the research alerts you would like to receive and click Subscribe. Alerts will be sent as research is published.
We respect your privacy. We will never share or sell your information.
If you have questions or need further information, please contact us directly and we will respond to your inquiry within 24 hours.
Contact Us >