Greg Leonberger, FSA, EA, MAAA, FCA
Partner, Director of Research


Flash talk by Greg Leonberger, FSA, EA, MAAA, at Marquette’s 2017 Investment Symposium
What is cryptocurrency? We examine how cryptocurrency is transacted, including how blockchains function, then dive into Bitcoin’s uses, acquisition, mining, and circulation. As an investment, the last few years have shown impressive (and frightening) growth, but we caution investors to be aware of the volatility within Bitcoin and look back at tulips for some insight. There are many challenges and unknowns cryptocurrencies face, and it is still early in the game to determine whether Bitcoin will (or can) become a conventional medium of exchange.

The opinions expressed herein are those of Marquette Associates, Inc. (“Marquette”), and are subject to change without notice. This material is not financial advice or an offer to purchase or sell any product. Marquette reserves the right to modify its current investment strategies and techniques based on changing market dynamics or client needs.

10.08.2026
This video is a recording of a live webinar held October 22 by Marquette’s research team analyzing the third quarter…

10.22.2026
Anyone who has run a marathon knows the last six miles are brutal — no matter how well the first…
10.19.2026
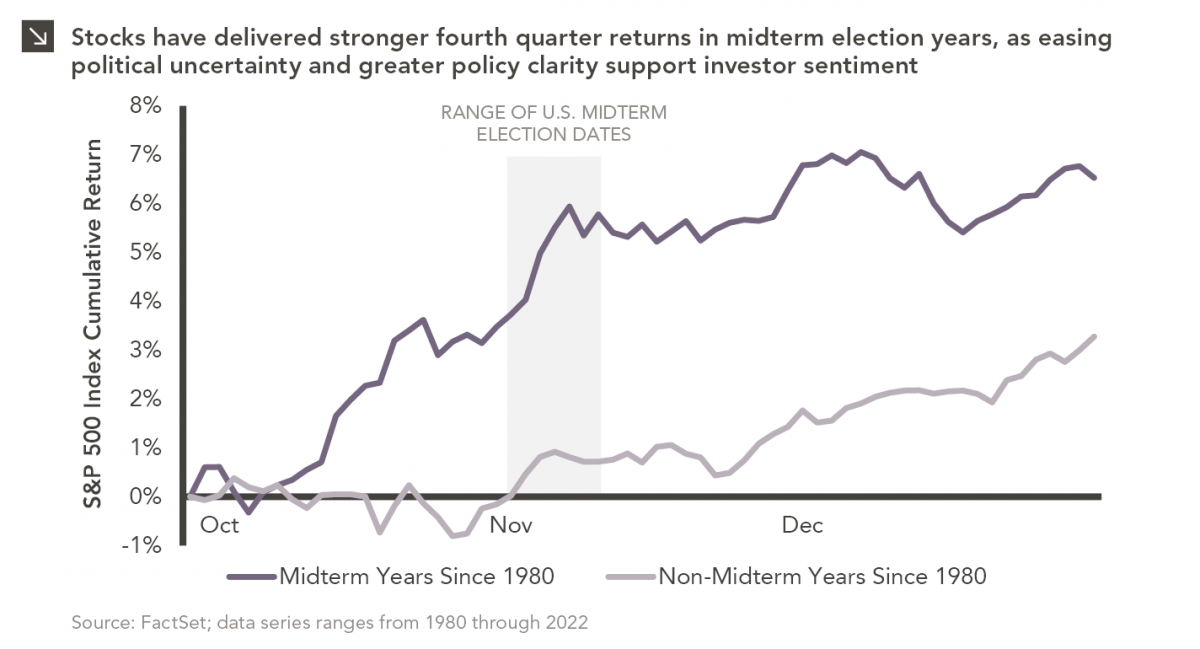
Since 1980, the S&P 500 Index has generally performed well in the weeks surrounding U.S. midterm elections. Specifically, the index…
09.28.2026
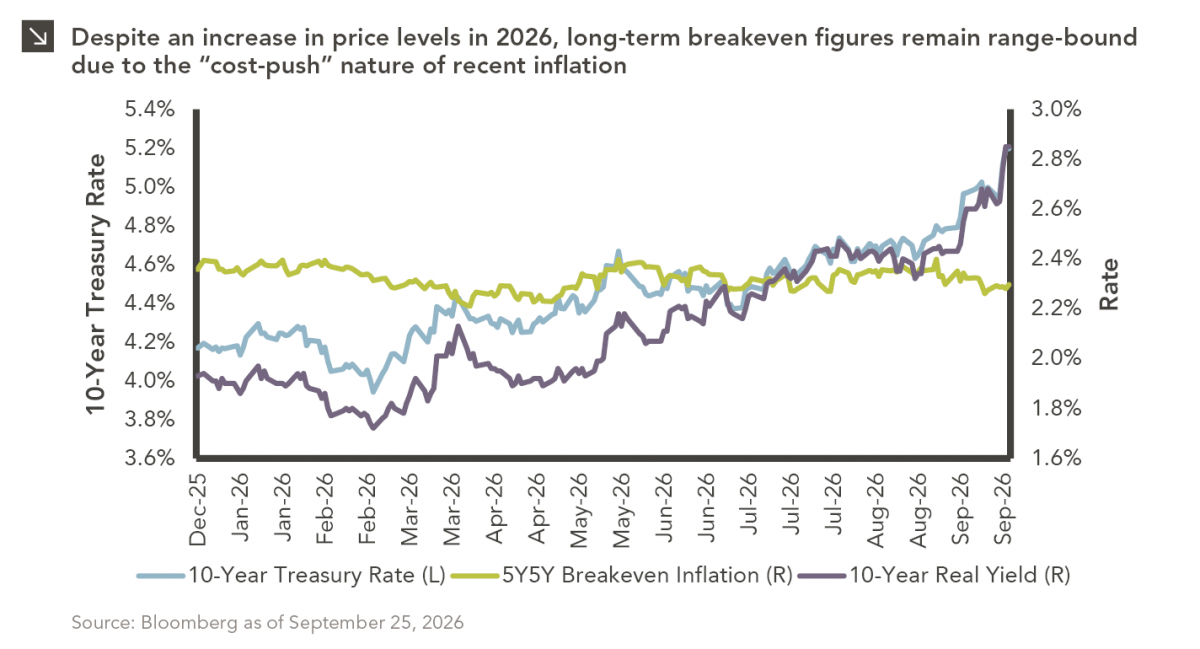
The phrase “expectations of higher inflation” has become a staple in financial news to explain the increase in nominal U.S….
09.08.2026
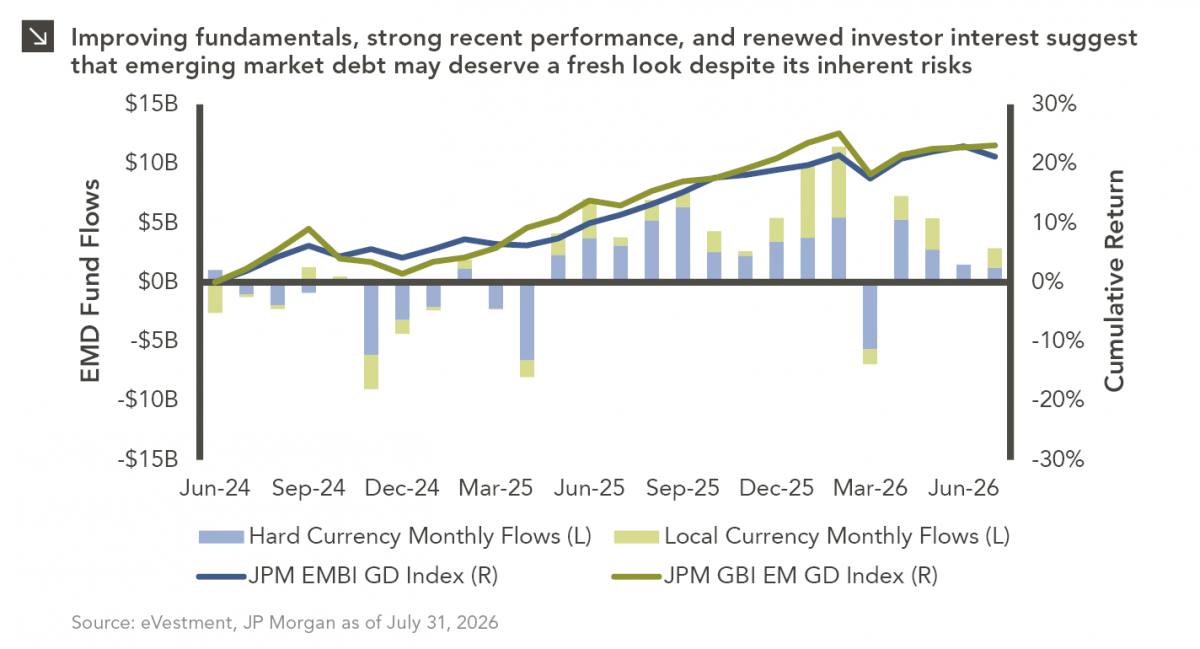
Over the last several years, emerging market debt (EMD) has faced several headwinds, with rising yields across other fixed income…
08.10.2026
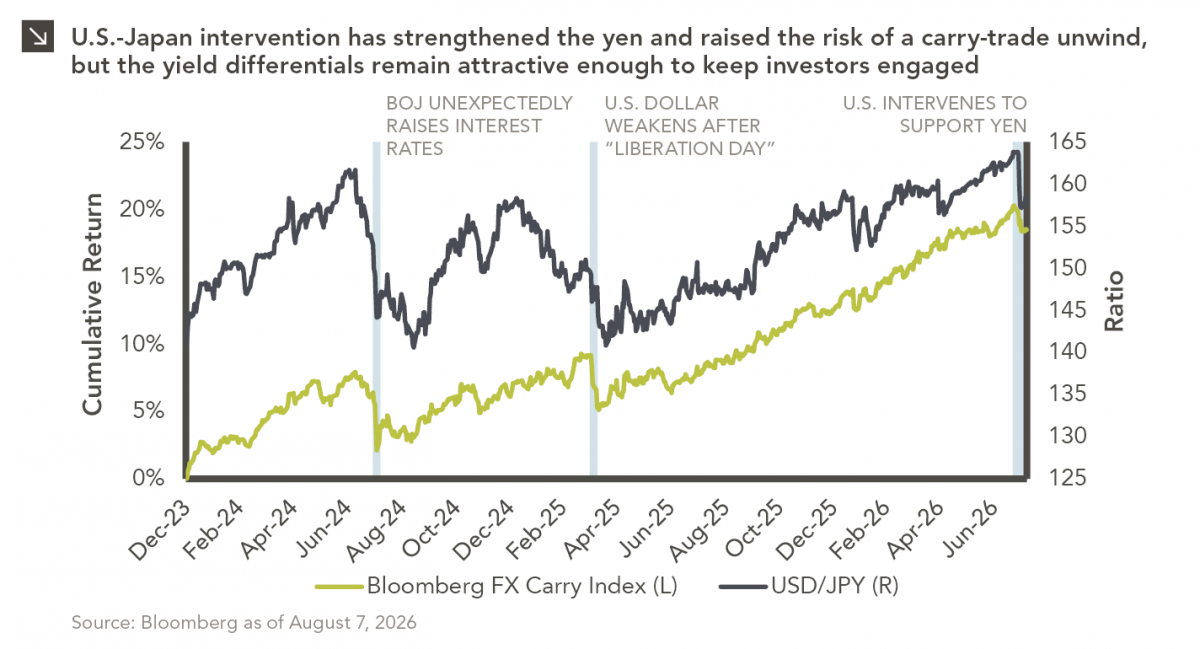
After reaching nearly ¥164 per dollar, its weakest level in roughly four decades, the yen had become a source of…
Research alerts keep you updated on our latest research publications. Simply enter your contact information, choose the research alerts you would like to receive and click Subscribe. Alerts will be sent as research is published.
We respect your privacy. We will never share or sell your information.
If you have questions or need further information, please contact us directly and we will respond to your inquiry within 24 hours.
Contact Us >