09.14.2026
No More Free Lunch?
There are many great things about working at Marquette Associates, but “Free Lunch Tuesday” is right at the top of…


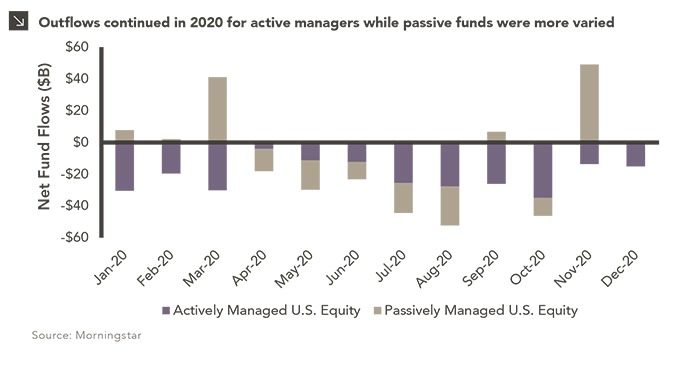
Fund flows, which measure the net movement of assets into and out of investment vehicles like mutual funds and exchange-traded funds (“ETFs”), can provide a window into investor behavior and are often an indication of investor sentiment. Strong inflows can indicate optimism within a particular asset class or investment style, while outflows may suggest pessimism on the part of investors. That said, a robust market is not always supported by investor inflows, as underlying fund flows and market index performance frequently deviate. This phenomenon was on display in 2020 and merits further evaluation.
The S&P 500 index posted a double-digit return in 2020 and closed the year at an all-time high, despite record-breaking outflows from U.S. equity funds. Nearly $241 billion flew out of domestic equity funds in 2020, a figure that is more than four times the previous calendar year record set in 2015. Perhaps unsurprisingly, these outflows centered predominately around actively managed products, a trend that has been persistent since 2014. Active funds saw net outflows in every month of 2020, while passive funds enjoyed bursts of investor interest, with extreme net inflows in both March (after the market bottomed) and November (due to positive coronavirus vaccine news). Investor preference for ETFs over mutual funds is particularly noteworthy. ETFs have risen in popularity as a lower-cost alternative to mutual fund investing and carry little-to-no investment minimum with real-time pricing. In November, passive ETFs saw a staggering net inflow of more than $54 billion, which is $12 billion more than the last monthly record set in December of 2016. This historic net inflow provided a tailwind to an already optimistic investor base and propelled indices like the Russell 2000 index, which tracks the U.S. small-cap market, to post its strongest returning month on record.
Hefty inflows for passive vehicles, like those in November, can have unfortunate implications for active investment managers. Many of these investment professionals are constructing a relatively small basket of securities with the intent to outperform a benchmark, often with less risk, over the long term. Commonly, these managers focus on quality metrics like top line growth, gross margins, earnings, and lower debt levels to drive outperformance. When a wave of inflows hits passive products, we see a “rising tide lifts all boats” phenomenon that is largely detached from underlying stock fundamentals. This can cause a short-term price dislocation and distortion of investor sentiment. Ultimately, the immediate impact of fund flows is temporary, but the continued trend away from active management may pose a greater threat to the asset management industry if portfolio managers fail to improve benchmark-relative performance.
Print PDF > Record Flows: Another Headwind for Active Management
The opinions expressed herein are those of Marquette Associates, Inc. (“Marquette”), and are subject to change without notice. This material is not financial advice or an offer to purchase or sell any product. Marquette reserves the right to modify its current investment strategies and techniques based on changing market dynamics or client needs.

09.14.2026
There are many great things about working at Marquette Associates, but “Free Lunch Tuesday” is right at the top of…

09.08.2026
Over the last several years, emerging market debt (EMD) has faced several headwinds, with rising yields across other fixed income…

08.31.2026
Private equity has always had a few portfolio companies that refused to leave the party. Today, however, the industry appears…

08.24.2026
The global bond market is facing renewed pressure as investors demand higher yields to hold long-dated government debt, pushing borrowing…

08.17.2026
As a college football player struggling to put on mass, the “supersizing” deal at McDonald’s was hard to beat. For…

08.10.2026
After reaching nearly ¥164 per dollar, its weakest level in roughly four decades, the yen had become a source of…
Research alerts keep you updated on our latest research publications. Simply enter your contact information, choose the research alerts you would like to receive and click Subscribe. Alerts will be sent as research is published.
We respect your privacy. We will never share or sell your information.
If you have questions or need further information, please contact us directly and we will respond to your inquiry within 24 hours.
Contact Us >