11.03.2025
No Small Headwind for Small-Cap Managers
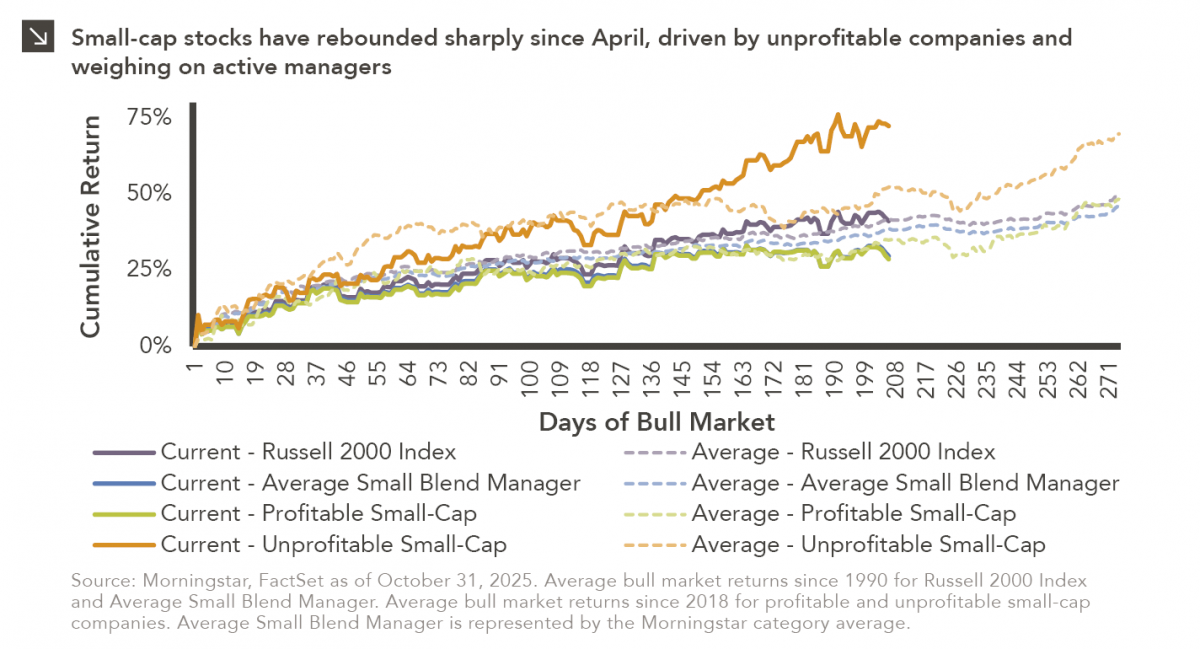
Small-cap equities are in a prolonged period of underperformance relative to large-cap stocks, but this trend has shown early signs…


Last week, Federal Reserve Chair Jerome Powell indicated the potential tapering of bond purchases at some point in the future aimed at weaning the U.S. economy off the large-scale monetary stimulus that has been necessary during the COVID-19 pandemic. As exhibited by the current forward rates displayed in this week’s chart, the forecasted Fed tapering may result in gradual increases in the 10-year U.S. Treasury yield in the coming months. Since yields move opposite prices, the Fed’s expected Treasury-buying reduction is leading the Treasury forward market to anticipate prices to potentially decline with the lowered demand and yields to rise. Likewise, as the U.S. economy gradually recovers from the pandemic, the Treasury forward market might also be pricing in reduced Treasury purchases from the broader market as investors switch to riskier growth assets such as credit or equities. That said, these actions will likely cause fewer disruptions in the markets than those taken at the onset of the Taper Tantrum, which began roughly eight years ago. Investors were caught off guard when Fed policymakers announced the potential reduction of asset purchases in 2013, which led to a bond sell-off fueled by widespread fears of future price declines. These sales drove down the prices of fixed income securities significantly, causing the 10-year Treasury yield to skyrocket in a very short period of time. In addition to current forward rates, this week’s chart also illustrates this dramatic increase in the 10-year Treasury yield during the Taper Tantrum, including a surge from 1.70% to 2.61% within a three-month window. This movement is in stark contrast with current market expectations, which project the 10-year Treasury yield to increase from 1.50% to only 1.68% over the next nine months.
Although there are ongoing concerns surrounding COVID-19 and the possibility of contagion from a fallout in the Chinese real estate sector that may hamper markets in the near term, investors seem to be reacting to forecasted Fed tapering more favorably than they have in the past. This may be due to the belief that strong economic growth can support the Fed’s gradual pullback of monetary stimulus. It is also possible that the Fed has simply done a better job telegraphing future actions this time around and investors are comfortable with the gradual nature of the forecasted tapering program. It should additionally be noted that tapering will not start immediately, as policymakers are only looking to reduce support when they think the economy can sustain itself as conditions normalize.
Print PDF > What Does Fed Tapering Mean for U.S. Yields?
The opinions expressed herein are those of Marquette Associates, Inc. (“Marquette”), and are subject to change without notice. This material is not financial advice or an offer to purchase or sell any product. Marquette reserves the right to modify its current investment strategies and techniques based on changing market dynamics or client needs.

11.03.2025
Small-cap equities are in a prolonged period of underperformance relative to large-cap stocks, but this trend has shown early signs…

10.27.2025
To paraphrase a quote from former President George W. Bush: “Fool me once, shame on… shame on you. Fool me…

10.22.2025
This video is a recording of a live webinar held October 22 by Marquette’s research team analyzing the third quarter…
10.22.2025
I spent the past weekend at my alma mater to watch them play their biggest rival. Football weekends there are…

10.20.2025
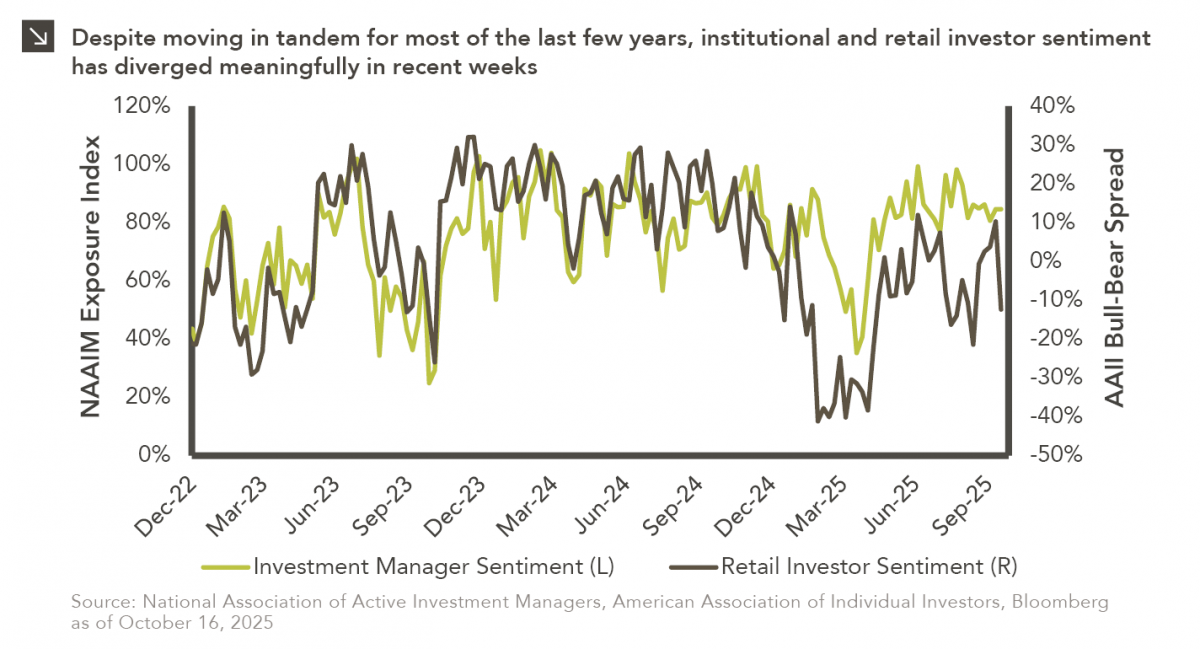
This week’s chart compares institutional and retail investor sentiment using two established indicators. Institutional sentiment is represented by the National…

10.13.2025
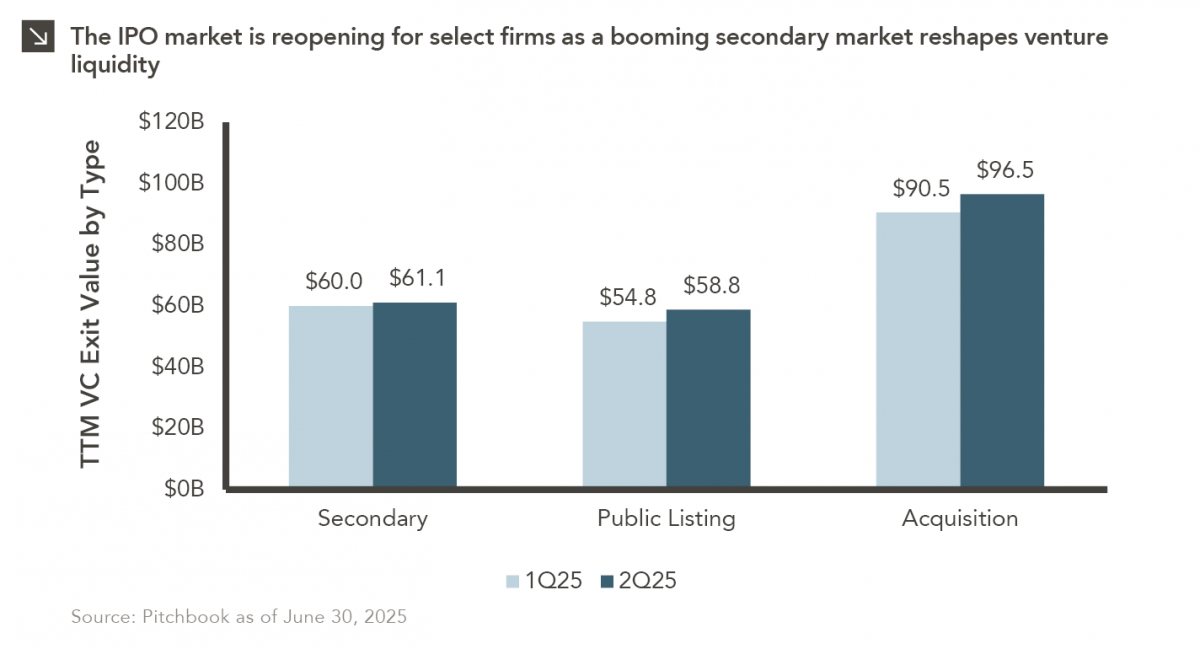
After a three-year drought, the IPO market is stirring again… but only for a select few. Just 18 companies have…
Research alerts keep you updated on our latest research publications. Simply enter your contact information, choose the research alerts you would like to receive and click Subscribe. Alerts will be sent as research is published.
We respect your privacy. We will never share or sell your information.
If you have questions or need further information, please contact us directly and we will respond to your inquiry within 24 hours.
Contact Us >