Greg Leonberger, FSA, EA, MAAA, FCA
Partner, Director of Research


Though the leaves have only started to change color, holiday party planning is in full swing. And while ample food and drink are necessary inputs for any type of holiday celebration, it’s the guests who ultimately make the party…or break it. In a way, this dynamic isn’t all that different from the markets — at any given time, the prevailing economic and market conditions will dictate investor returns. Given this analogy, we thought it could be fun to take a survey of the “attendees” in the current market environment and see if we can draw a connection with real-life examples along with what each guest means to the success of the party…and investor. Oh, and one caveat as we go — similar to actual party planning, sometimes we don’t want to invite someone, but we have to invite this person; circling back to the financial markets, we can’t control what forces exist in the markets, but we will do our best to determine those that will be merry and those that will not. Confused? Don’t worry, I am too, but we’ll figure this as we go through the invite list.
Highlights from this edition:
Read > The Holiday Party Guest List
Watch our Q3 2021 Market Insights Video for an in-depth analysis of the third quarter’s performance by Marquette’s research team.

The opinions expressed herein are those of Marquette Associates, Inc. (“Marquette”), and are subject to change without notice. This material is not financial advice or an offer to purchase or sell any product. Marquette reserves the right to modify its current investment strategies and techniques based on changing market dynamics or client needs.
11.09.2026
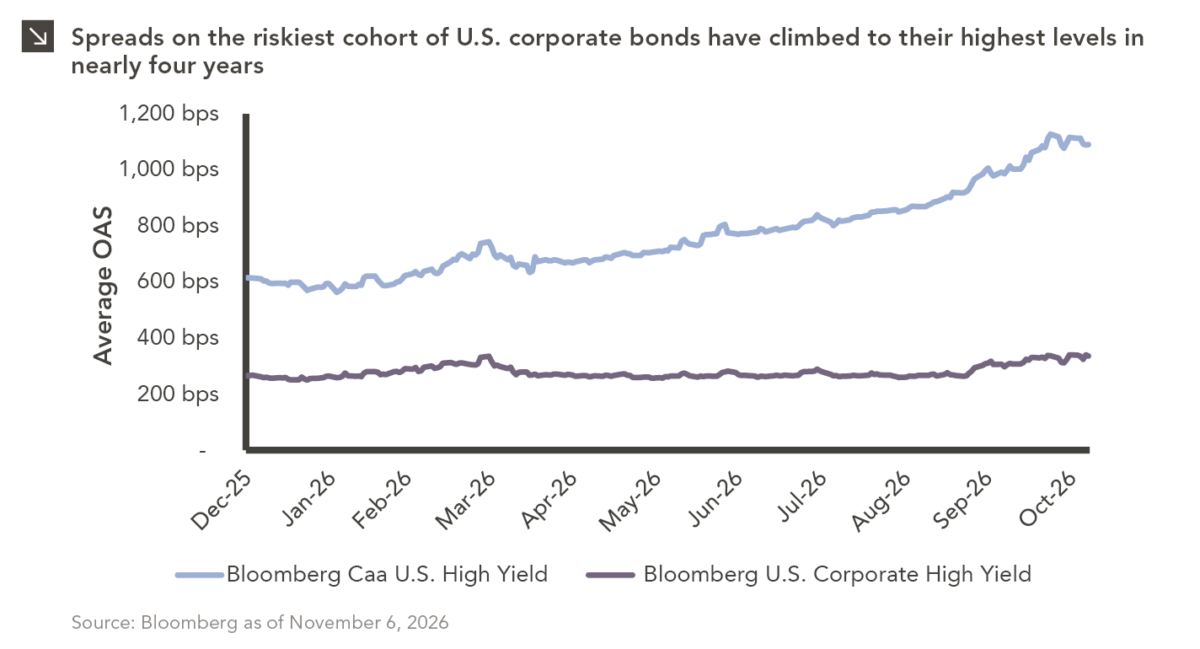
The U.S. distressed debt market is showing increasingly pronounced signs of stress. As of this writing, option-adjusted spreads on CCC-rated…
11.02.2026
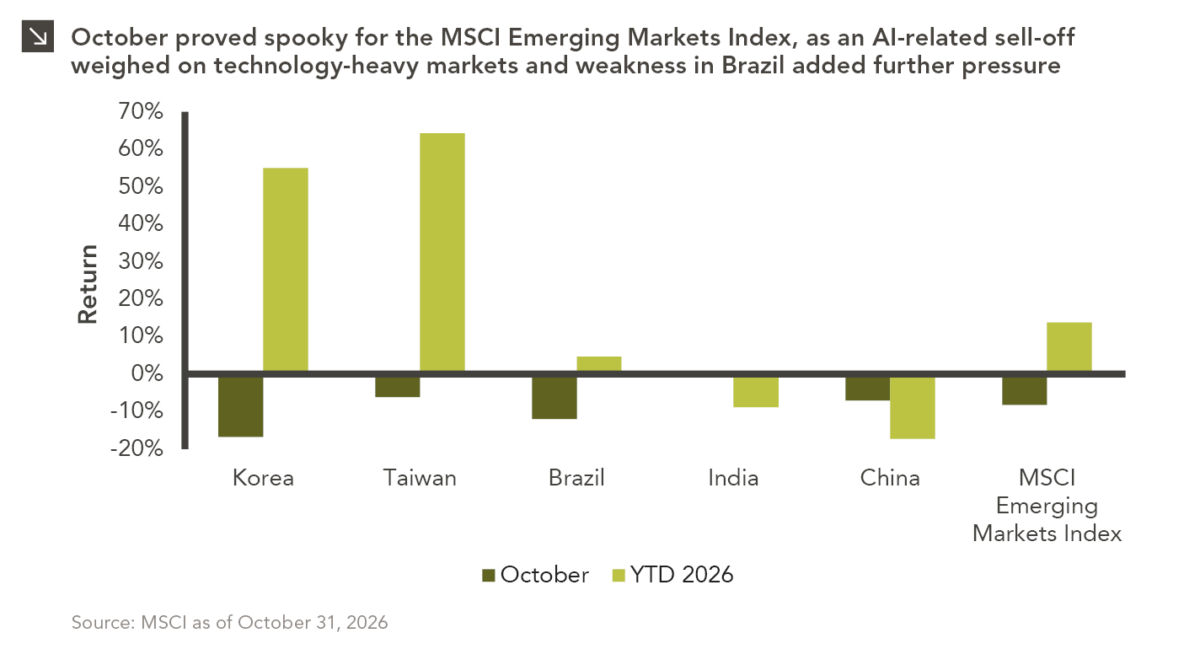
Emerging markets faced a challenging October, with the space declining by around 8.3% amid renewed concerns over the sustainability of…
10.26.2026
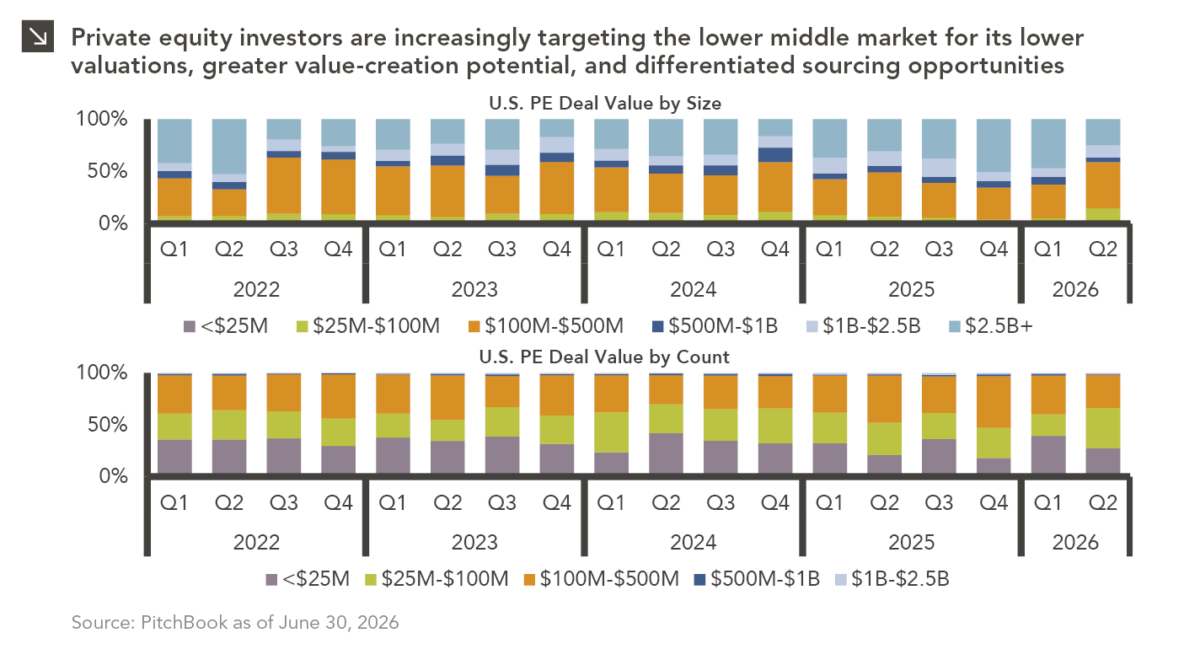
Private equity activity is increasingly shifting toward smaller transactions, with total deal value for transactions of $100 million or less…

10.08.2026
This video is a recording of a live webinar held October 22 by Marquette’s research team analyzing the third quarter…
10.22.2026
Anyone who has run a marathon knows the last six miles are brutal — no matter how well the first…
10.19.2026
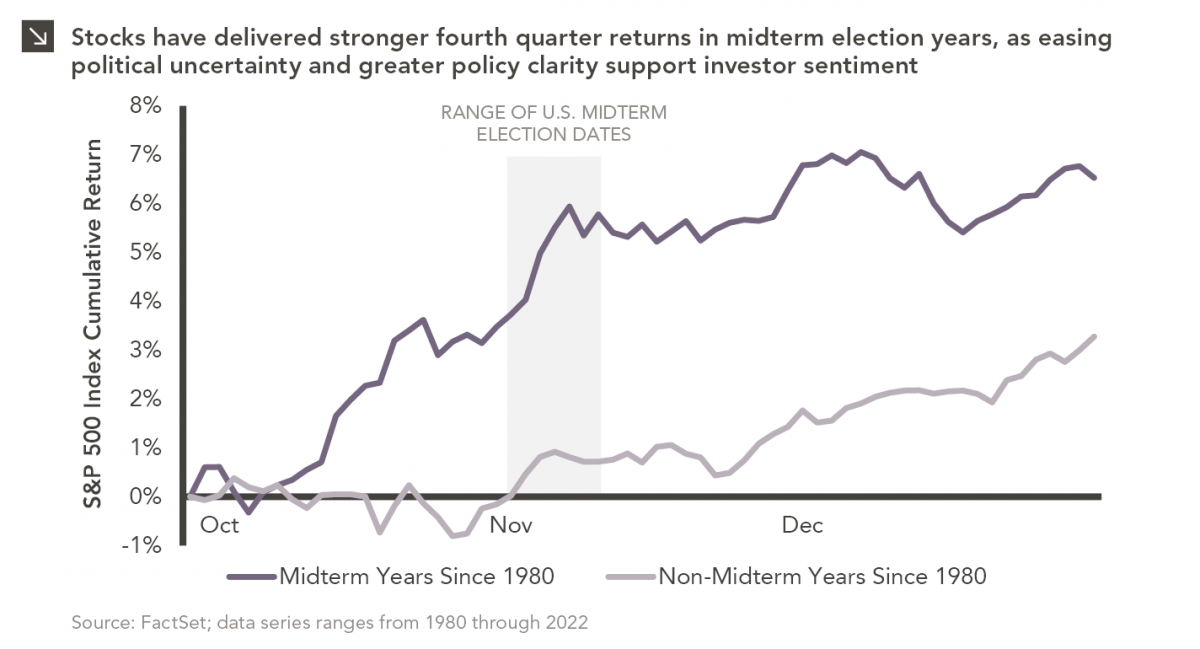
Since 1980, the S&P 500 Index has generally performed well in the weeks surrounding U.S. midterm elections. Specifically, the index…
Research alerts keep you updated on our latest research publications. Simply enter your contact information, choose the research alerts you would like to receive and click Subscribe. Alerts will be sent as research is published.
We respect your privacy. We will never share or sell your information.
If you have questions or need further information, please contact us directly and we will respond to your inquiry within 24 hours.
Contact Us >