To Inflation and Beyond

August 09, 2022

Four-line chart showing rent growth in various sectors of real estate. Chart subtitle: Industrial and multifamily rent growth has outpaced inflation; retail and office have not kept up with increasing replacement, capex, and maintenance costs. Chart visual description: Y-axis shows Real Rent Growth, ranging from -15% to +10%. X-axis shows years from 2001 to 2022. MultiFamily line is green, Industrial line is brown, Office line is blue, and Retail line is slate. Chart data description: Since 2020, both office and retail have declined, though both experienced a slight period of growth in 2021. MultiFamily declined during the 2020 downturn, increased to a peak in 2021, but has decreased this year. Industrial has held relatively stable and though it declined in the pandemic, has nearly recovered. Chart sources: CoStar, JP Morgan Chase Research as of June 30, 2022. Real rent growth is defined as the year-over-year change in property rents less inflation.

Real estate as an asset class is not immune to the effects of inflation and rising rates, but certain sectors within real estate can help investors manage through the volatility. Typically, inflation manifests itself within commercial real estate in the form of higher prices for construction materials, labor, and land. Since the onset of the pandemic, the Producer Price Index for Construction Materials, which measures the average price change of building materials over time, has skyrocketed by over 50% as of June 30, 2022.¹ These rising development costs and value-add expenditures create a headwind for real estate valuations, diluting the value of incremental rental income. However, as inflationary pressures continue to weigh on economic growth, real estate should be well positioned as a solid, though imperfect, inflation hedge. Multifamily and hotel properties benefit from the flexibility of shorter-duration leases that allow property owners to reset rents in line with market levels. Moreover, value-add and opportunistic managers are well positioned to enter deal flow at attractive unlevered price points, extracting value from industrial and retail investments that benefit from guaranteed rent increases and tenant pass-through costs. Real estate investments are an important part of alternatives allocations at Marquette as they can help diversify a portfolio and hedge against inflation while providing attractive risk-adjusted returns.

Print PDF > To Inflation and Beyond

¹Bloomberg, Bureau of Labor Statistics, Federal Reserve Bank of St. Louis, CBRE-EA, Clarion Partners Investment Research, June 2022


The opinions expressed herein are those of Marquette Associates, Inc. (“Marquette”), and are subject to change without notice. This material is not financial advice or an offer to purchase or sell any product. Marquette reserves the right to modify its current investment strategies and techniques based on changing market dynamics or client needs.

The opinions expressed herein are those of Marquette Associates, Inc. (“Marquette”), and are subject to change without notice. This material is not financial advice or an offer to purchase or sell any product. Marquette reserves the right to modify its current investment strategies and techniques based on changing market dynamics or client needs.

Related Content

10.08.2026

3Q 2026 Market Insights

This video is a recording of a live webinar held October 22 by Marquette’s research team analyzing the third quarter…

Line chart comparing S&P 500 Index cumulative returns for midterm and non-midterm election years since 1980. The x-axis shows October through December, and the y-axis shows S&P 500 Index cumulative return, ranging from -1% to 8%. For full dataset, please contact marquettemarketing@marquetteassociates.com.

10.19.2026

Divided We Rise?

Since 1980, the S&P 500 Index has generally performed well in the weeks surrounding U.S. midterm elections. Specifically, the index…

Chart #1 - Line chart showing PJM summer peak load estimates in gigawatts (GW) from 2015 to 2045. The chart compares historical peak load, current capacity, and forecasts from 2024, 2025, and 2026, showing projected demand rising above current capacity over time. Chart #2 - Stacked bar chart showing U.S. power demand in terawatt-hours (TWh) for 2025 and estimated demand in 2030. The chart compares data center and non-data center demand, showing total power demand increasing over the period.

10.12.2026

The Power Demand Supercycle

This week’s chart highlights the accelerating growth of electricity demand in the U.S., which has been driven primarily by the…

Bar chart showing average monthly VIX levels from 1990 through October 2026. The x-axis displays months of the year from January through December, and the y-axis displays VIX level. October has the highest average VIX level among all months, while April has the lowest. The chart also includes a current VIX level and a long-term average VIX level for comparison. Source: Bloomberg as of October 2, 2026. Data series begins in 1990. For full dataset, please contact marquettemarketing@marquetteassociates.com.

10.05.2026

Spooky Season

For investors, the spookiest thing about October might not be the ghosts and monsters that are bound to show up…

Line chart showing 10-year U.S. Treasury rate, 5-year/5-year breakeven inflation rate, and 10-year real yield from December 2025 through September 2026. The left axis shows rates from 3.6% to 5.4%, and the right axis from 1.6% to 3.0%. The Treasury rate and real yield rise notably in late 2026, while the breakeven inflation rate remains relatively range-bound around 2.3%–2.4%. For full dataset, please contact marquettemarketing@marquetteassociates.com.

09.28.2026

Getting Real on Inflation

The phrase “expectations of higher inflation” has become a staple in financial news to explain the increase in nominal U.S….
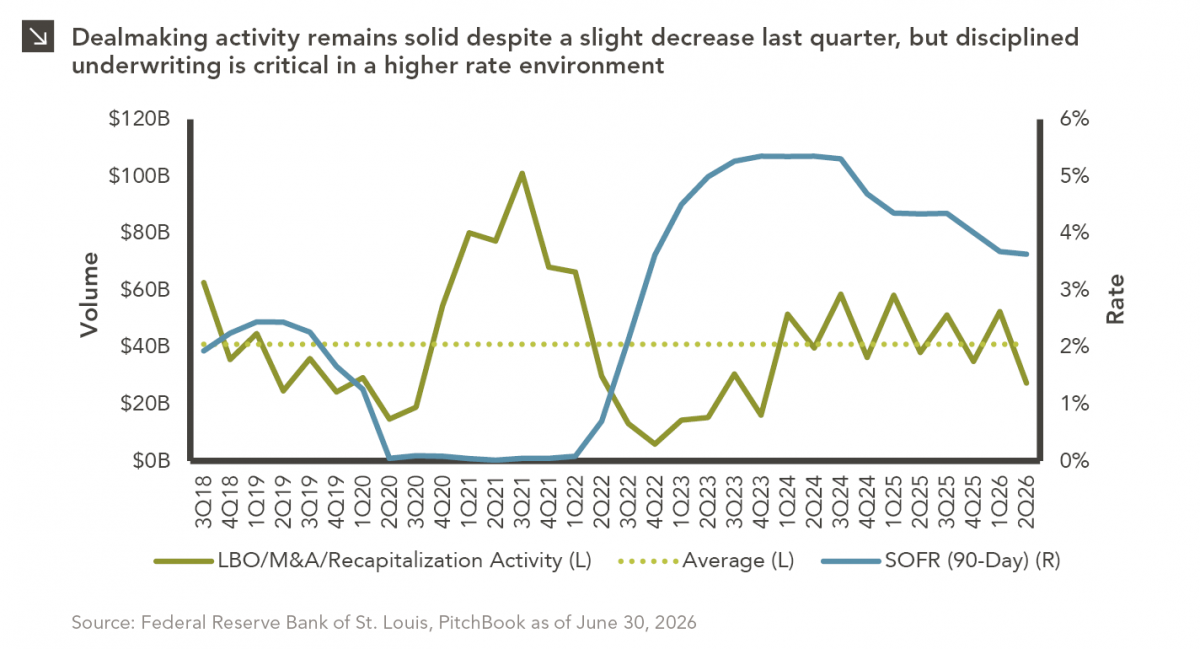
Dual-axis line chart comparing LBO/M&A/Recapitalization Activity, its average level, and the SOFR (90-Day) rate from 3Q18 through 2Q26. LBO/M&A/Recapitalization Activity ranges from approximately $0 billion to $100 billion, while SOFR ranges from 0% to approximately 5%. For full dataset, please contact marquettemarketing@marquetteassociates.com.

09.21.2026

Let’s Make a Deal

For much of the past several years, the conventional view has been that higher interest rates and stretched valuations would…

More articles

Subscribe to Research Email Alerts

Research Email Alert Subscription

Research alerts keep you updated on our latest research publications. Simply enter your contact information, choose the research alerts you would like to receive and click Subscribe. Alerts will be sent as research is published.

We respect your privacy. We will never share or sell your information.

Thank You

We appreciate your interest in Marquette Associates.

If you have questions or need further information, please contact us directly and we will respond to your inquiry within 24 hours.

Contact Us >

