This Exit Closed

September 08, 2022 | Hayley McCollum, Senior Research Analyst

Combination stacked column and line chart showing U.S. venture capital exit activity. Chart subtitle: Venture capital exit activity and exit value are down significantly from 2021 levels. Chart visual description: Left Y-axis shows “U.S. Venture Capital Exit Activity Count” and ranges from 0 to 2,000. X-axis shows years from 2007 through 1H22. Right Y-axis shows “U.S. VC Exit Activity ($B)” and ranges from $0 to $800B. Each column is comprised of three parts: in light blue, Acquisitions, in light green, Public Listings, and in light teal Buyouts. A dark tan line overlaps all representing the Total Venture Capital Exit Value. Chart data description: As of June 30th, VC exit counts are not yet at half of 2021’s level (1806 exits), but fairly in line with levels from 2014-2020. Total Value, however, is much lower; and 2022 is on track to come in at less than 15% of 2021’s level ($48B vs. $777B in 2021). 2021 was a huge peak for both sets of data. Chart sources: Pitchbook, Wall Street Journal as of June 30, 2022. End chart description.

Amid public market turbulence, venture capital exit activity and total exit value so far in 2022 are down significantly from peak 2021 levels. The venture-backed exit value in the U.S. came in just under $50 billion in the first half of the year. If this pace continues, 2022 is on track to come in at less than 15% of 2021 levels, returning to an exit value range last seen in 2017.

The number of acquisitions and buyouts as forms of exit are tracking close to 2021 numbers. Firms at the lower end of the market commonly use acquisitions and buyouts as exit strategies. This area of the market has also been more resilient against public market compares. Weakness in the IPO market — potentially on track for its worst year since Dealogic began tracking it in 1995 — is having the greatest impact on the decline in exit value. The IPO market has essentially shut down for venture capital-backed businesses. The familiar macroeconomic headwinds — high inflation, rising interest rates, and the risk of recession — have weighed on venture capital valuations alongside public market equities. Startups that were planning on an IPO are now forced to reevaluate their options. In the meantime, these companies have to rely on the strength of their balance sheets and the financial backing of sponsors. For companies still early in their life cycle and burning cash, liquidity may be a growing concern. Since valuations are down, VC managers are predicting 2022 could in theory be an attractive vintage year and entry point into the VC market. Partnering with VC managers who have experience investing through business cycles and periods of high and low valuations will prove to be important. Overall, with the outlook for the IPO market still uncertain, we are carefully monitoring the impact to the VC landscape and the potential impact to investors.

Print PDF > This Exit Closed


The opinions expressed herein are those of Marquette Associates, Inc. (“Marquette”), and are subject to change without notice. This material is not financial advice or an offer to purchase or sell any product. Marquette reserves the right to modify its current investment strategies and techniques based on changing market dynamics or client needs.

Hayley McCollum
Senior Research Analyst

Get to Know Hayley

The opinions expressed herein are those of Marquette Associates, Inc. (“Marquette”), and are subject to change without notice. This material is not financial advice or an offer to purchase or sell any product. Marquette reserves the right to modify its current investment strategies and techniques based on changing market dynamics or client needs.
Related Content

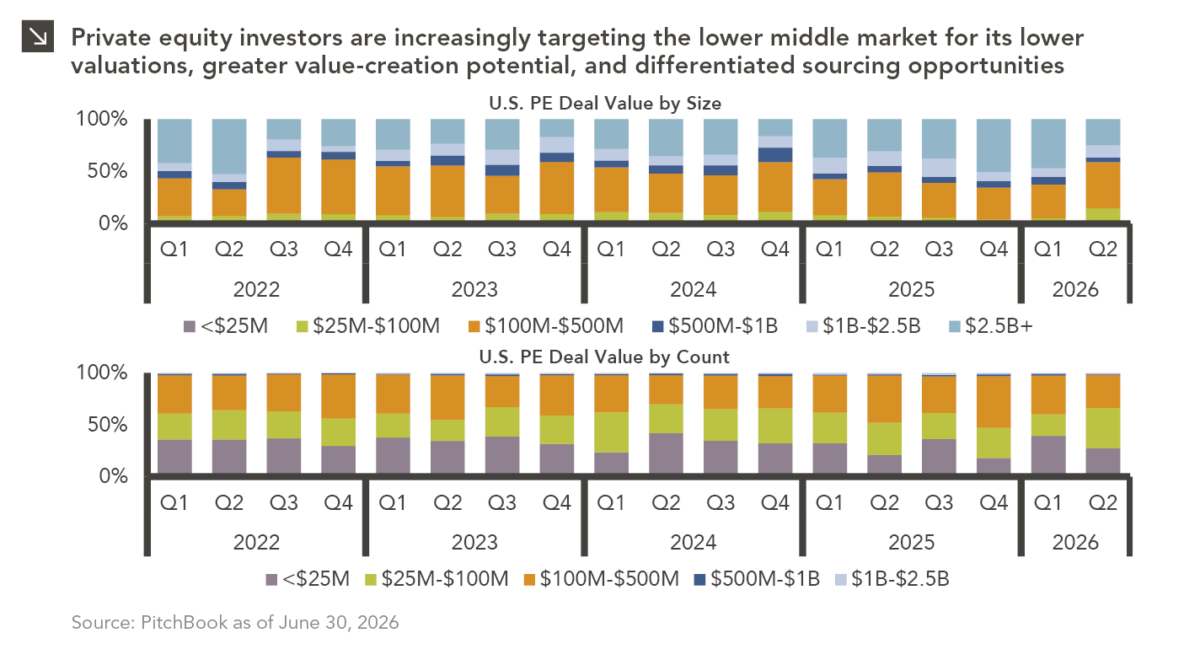
Stacked bar chart showing U.S. private equity deal value by deal size from Q1 2022 through Q2 2026. The y-axis shows percentage of total deal value from 0% to 100%, and the x-axis shows quarters by year. Stacked bar chart showing the percentage of U.S. private equity deal count by deal size from Q1 2022 through Q2 2026. The y-axis ranges from 0% to 100%, and the x-axis shows quarters by year. For full dataset, please contact marquettemarketing@marquetteassociates.com.

10.26.2026

Smaller Deals, Larger Appeal

Private equity activity is increasingly shifting toward smaller transactions, with total deal value for transactions of $100 million or less…

10.08.2026

3Q 2026 Market Insights

This video is a recording of a live webinar held October 22 by Marquette’s research team analyzing the third quarter…

Line chart comparing S&P 500 Index cumulative returns for midterm and non-midterm election years since 1980. The x-axis shows October through December, and the y-axis shows S&P 500 Index cumulative return, ranging from -1% to 8%. For full dataset, please contact marquettemarketing@marquetteassociates.com.

10.19.2026

Divided We Rise?

Since 1980, the S&P 500 Index has generally performed well in the weeks surrounding U.S. midterm elections. Specifically, the index…

Chart #1 - Line chart showing PJM summer peak load estimates in gigawatts (GW) from 2015 to 2045. The chart compares historical peak load, current capacity, and forecasts from 2024, 2025, and 2026, showing projected demand rising above current capacity over time. Chart #2 - Stacked bar chart showing U.S. power demand in terawatt-hours (TWh) for 2025 and estimated demand in 2030. The chart compares data center and non-data center demand, showing total power demand increasing over the period.

10.12.2026

The Power Demand Supercycle

This week’s chart highlights the accelerating growth of electricity demand in the U.S., which has been driven primarily by the…

Bar chart showing average monthly VIX levels from 1990 through October 2026. The x-axis displays months of the year from January through December, and the y-axis displays VIX level. October has the highest average VIX level among all months, while April has the lowest. The chart also includes a current VIX level and a long-term average VIX level for comparison. Source: Bloomberg as of October 2, 2026. Data series begins in 1990. For full dataset, please contact marquettemarketing@marquetteassociates.com.

10.05.2026

Spooky Season

For investors, the spookiest thing about October might not be the ghosts and monsters that are bound to show up…

Line chart showing 10-year U.S. Treasury rate, 5-year/5-year breakeven inflation rate, and 10-year real yield from December 2025 through September 2026. The left axis shows rates from 3.6% to 5.4%, and the right axis from 1.6% to 3.0%. The Treasury rate and real yield rise notably in late 2026, while the breakeven inflation rate remains relatively range-bound around 2.3%–2.4%. For full dataset, please contact marquettemarketing@marquetteassociates.com.

09.28.2026

Getting Real on Inflation

The phrase “expectations of higher inflation” has become a staple in financial news to explain the increase in nominal U.S….

More articles

Subscribe to Research Email Alerts

Research Email Alert Subscription

Research alerts keep you updated on our latest research publications. Simply enter your contact information, choose the research alerts you would like to receive and click Subscribe. Alerts will be sent as research is published.

We respect your privacy. We will never share or sell your information.

Thank You

We appreciate your interest in Marquette Associates.

If you have questions or need further information, please contact us directly and we will respond to your inquiry within 24 hours.

Contact Us >