Peter Como, CFA, CAIA
Associate Research Analyst
Get to Know Peter


With June and the Treasury’s estimated X-date quickly approaching, the debt ceiling issue came to a head over the weekend. While the spending deal reached between President Biden and House Speaker McCarthy still needs to be approved by Congress, it is an important milestone in the U.S. avoiding its first-ever default. While that worst-case scenario would have had catastrophic impacts on the economy, markets — as measured by the CBOE Volatility Index (VIX), known as the fear index — remained relatively calm. The VIX is measured using option activity and gauges the market’s appetite for volatility. Usually, the market and the VIX are negatively correlated, meaning the VIX increases as markets go down. As shown in the above chart, during times of stress, including debt ceiling uncertainty, the VIX tends to be more dynamic, with sharper jumps and falls. With markets having spent the last year heavily focused on inflation, labor markets, and the path of interest rates, which now seem at least near the peak, debt ceiling negotiations were overall taken in stride by equity markets. It is generally accepted that a VIX level above 30 indicates more investor uncertainty, which we have seen reached multiple times over the last few years, though during the month of May, the VIX peaked around 20. As noted, while the House and Senate still need to consider the bill this week, the most likely outcome is the debt ceiling bill is signed into law before the U.S. would have had to default on its debt obligations, removing one more headwind for markets this year.
Print PDF > Will the Summer Heat Make the Market Sweat?
The opinions expressed herein are those of Marquette Associates, Inc. (“Marquette”), and are subject to change without notice. This material is not financial advice or an offer to purchase or sell any product. Marquette reserves the right to modify its current investment strategies and techniques based on changing market dynamics or client needs.

11.10.2025
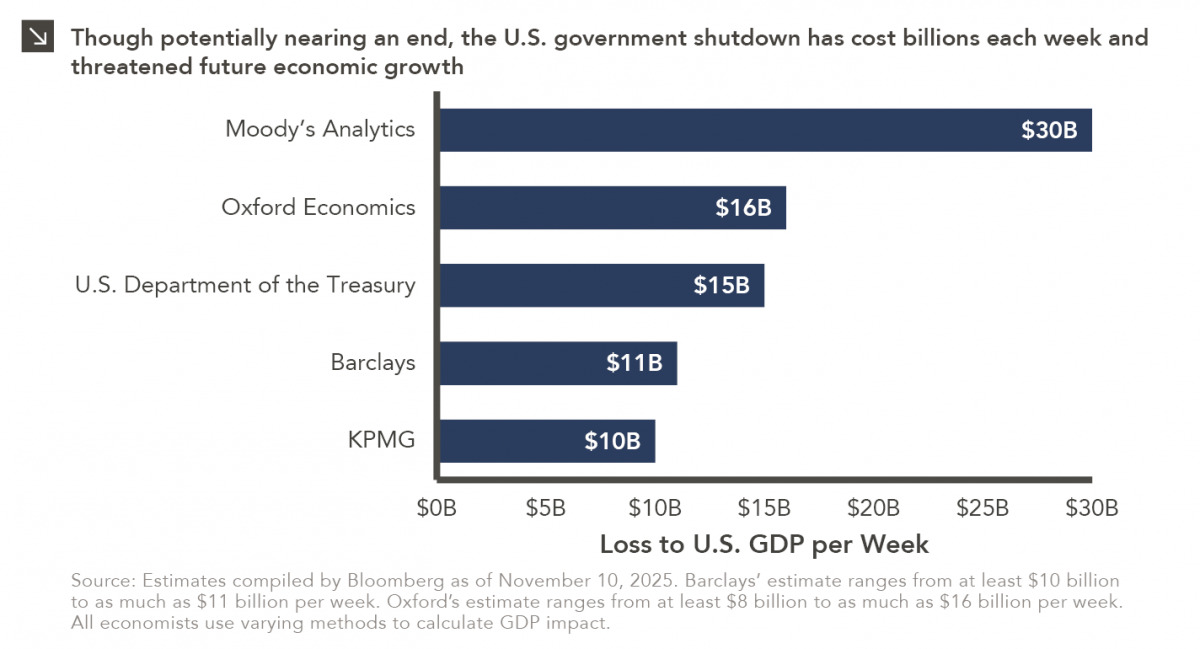
Over the weekend, the Senate overcame a key procedural obstacle in its attempt to end the record-breaking government shutdown, as…

11.03.2025
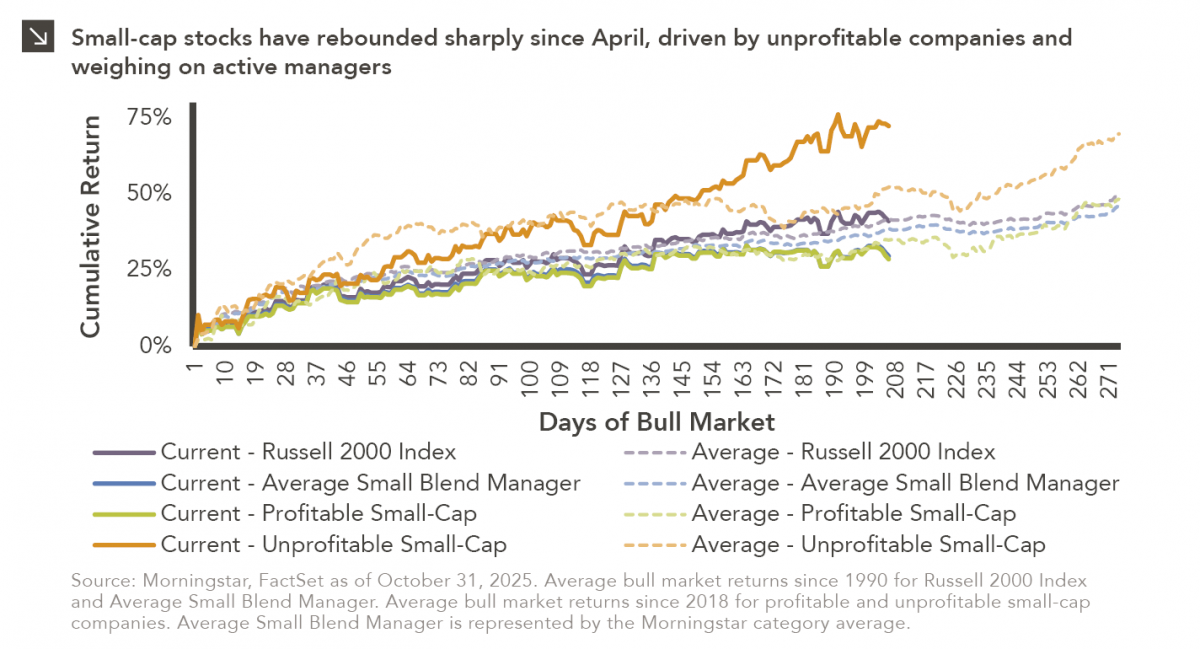
Small-cap equities are in a prolonged period of underperformance relative to large-cap stocks, but this trend has shown early signs…

10.27.2025
To paraphrase a quote from former President George W. Bush: “Fool me once, shame on… shame on you. Fool me…

10.22.2025
This video is a recording of a live webinar held October 22 by Marquette’s research team analyzing the third quarter…
10.22.2025
I spent the past weekend at my alma mater to watch them play their biggest rival. Football weekends there are…

10.20.2025
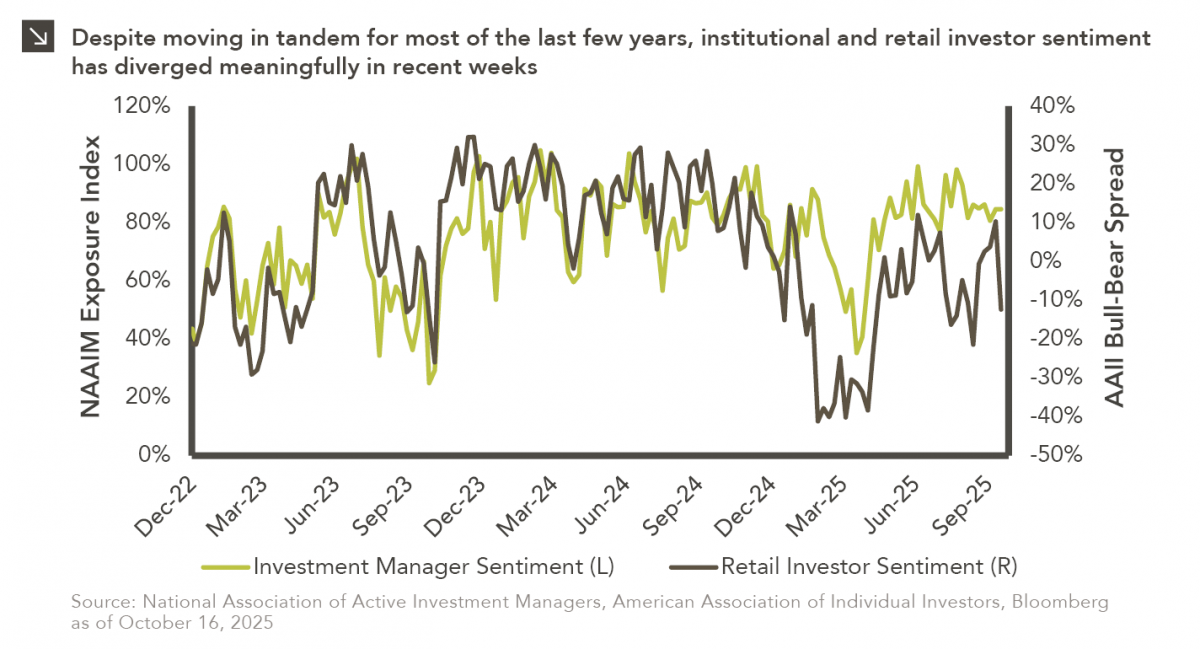
This week’s chart compares institutional and retail investor sentiment using two established indicators. Institutional sentiment is represented by the National…
Research alerts keep you updated on our latest research publications. Simply enter your contact information, choose the research alerts you would like to receive and click Subscribe. Alerts will be sent as research is published.
We respect your privacy. We will never share or sell your information.
If you have questions or need further information, please contact us directly and we will respond to your inquiry within 24 hours.
Contact Us >