If They Build It, Buyers Will Come

June 06, 2023 | Amy Miller, Associate Director of Private Equity

This chart description is for illustrative purposes only and its accuracy cannot be guaranteed. Please see full disclosures at end of PDF document in the web post. General description: Combination stacked column and line chart showing add-ons as a share of U.S. Buyouts. Chart subtitle: Add-ons are an important tool used by private equity to build valuable businesses. Chart source: PitchBook as of March 31, 2023. Chart visual description: Left y-axis is labeled “Number of Total Transactions by Type” and ranges from 0 to 9,000. Right y-axis is labeled “Add-on as a % of Buyout Transactions” and ranges from 0% to 90%. X-axis shows annual data from 2008 to 1Q23. Each column includes “Add-on” in dark brown and “non-add-on” in tan. Line above plots “Add-on % of Buyout” in orange, with 1Q23 plotted with a diamond marker instead of the line. Chart data description: Total transactions have generally increased since 2008; in 2008, there were 1,141 Add-Ons and 1,142 Non Add-ons, with 50% add-on % of Buyout. That percentage increased to 54% in 2009, 59% in 2013, 65% in 2018, and 77% in 2022; in 2022, there were 5,081 Add-on and 1,515 non add-on. Please contact our team for the full data set. End chart description. See disclosures at end of document.

Stalled sale processes have become the norm in the private equity market due to several factors, including a mismatch between buyer and seller expectations around price and interest rates. Private equity owners have been forced to pivot from the traditional leveraged buyout model, now taking on less debt as they look to create an asset that will be attractive to potential acquirers. One way to do this is to build a better business, including via add-on acquisitions, which have been growing as a proportion of buyout transactions for the last several years. In 2008, add-ons accounted for 50% of deal volume. In the first quarter of 2023, that amount was close to 80%.

Add-ons offer several benefits to private equity firms. First, they are an efficient way to expand and diversify a business’s geographical footprint, customer base, and product offering. Second, add-on acquisitions tend to be smaller businesses, and thus typically less expensive than larger platform investments, allowing the private equity manager to average down the total cost of the combined investment. Third, add-ons tend to be accretive, increasing revenue, EBITDA, and EBITDA margins. Taken together, with proper integration, the end business can become a more attractive acquisition target for both large private equity firms and corporations.

Print PDF > If They Build It, Buyers Will Come


The opinions expressed herein are those of Marquette Associates, Inc. (“Marquette”), and are subject to change without notice. This material is not financial advice or an offer to purchase or sell any product. Marquette reserves the right to modify its current investment strategies and techniques based on changing market dynamics or client needs.

Amy Miller
Associate Director of Private Equity

Get to Know Amy

The opinions expressed herein are those of Marquette Associates, Inc. (“Marquette”), and are subject to change without notice. This material is not financial advice or an offer to purchase or sell any product. Marquette reserves the right to modify its current investment strategies and techniques based on changing market dynamics or client needs.
Related Content

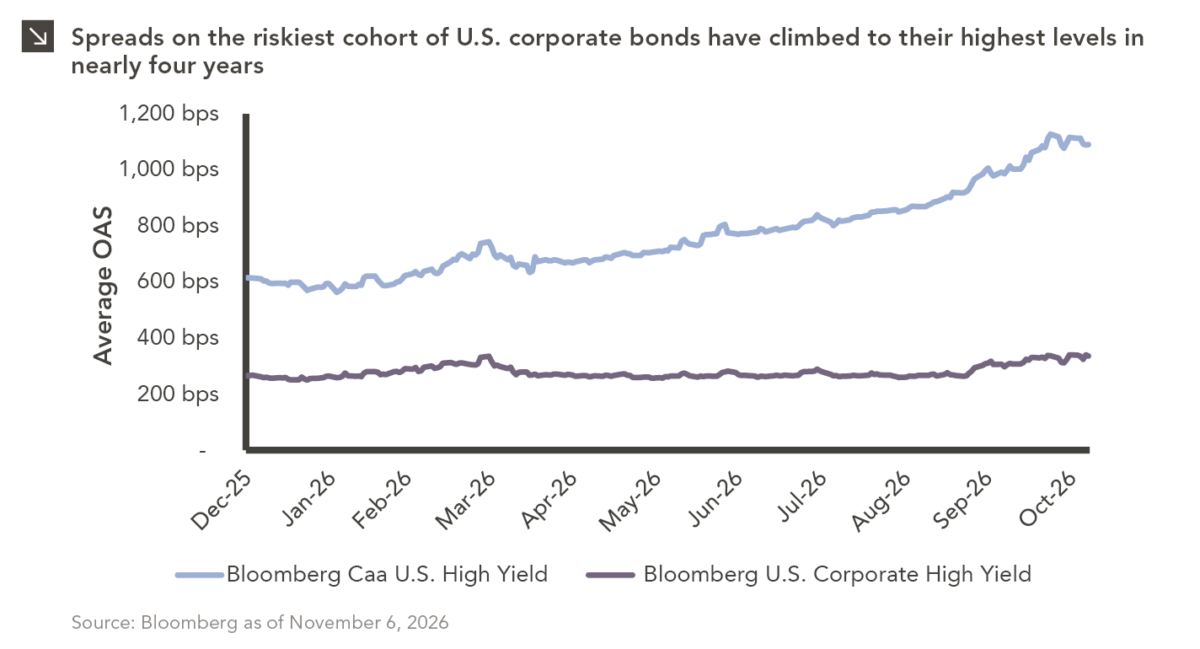
Line chart showing average option-adjusted spreads (OAS), in basis points, on Bloomberg CCC U.S. High Yield and Bloomberg U.S. Corporate High Yield bonds from December 2025 through October 2026. CCC-rated high yield spreads increased from approximately 600 bps to 1,100 bps, reaching their highest levels in nearly four years, while broader U.S. corporate high yield spreads remained relatively stable, increasing from approximately 260 bps to 330 bps. Source: Bloomberg as of November 6, 2026. For full dataset, please contact marquettemarketing@marquetteassociates.com.

11.09.2026

C’s Get Degrees (of Pain)

The U.S. distressed debt market is showing increasingly pronounced signs of stress. As of this writing, option-adjusted spreads on CCC-rated…
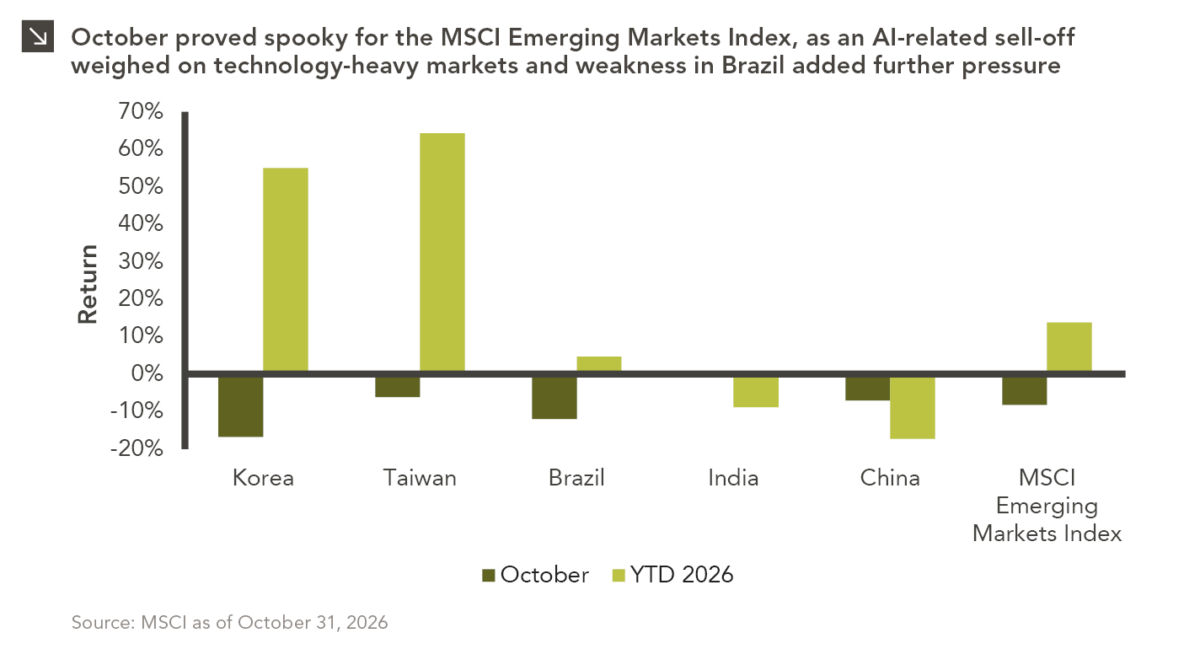
Bar chart comparing October and year-to-date 2026 returns for Korea, Taiwan, Brazil, India, China, and the MSCI Emerging Markets Index. October returns are below zero for most markets, while year-to-date returns range from negative to positive. For full dataset, please contact marquettemarketing@marquetteassociates.com.

11.02.2026

The Haunting of Emerging Markets

Emerging markets faced a challenging October, with the space declining by around 8.3% amid renewed concerns over the sustainability of…
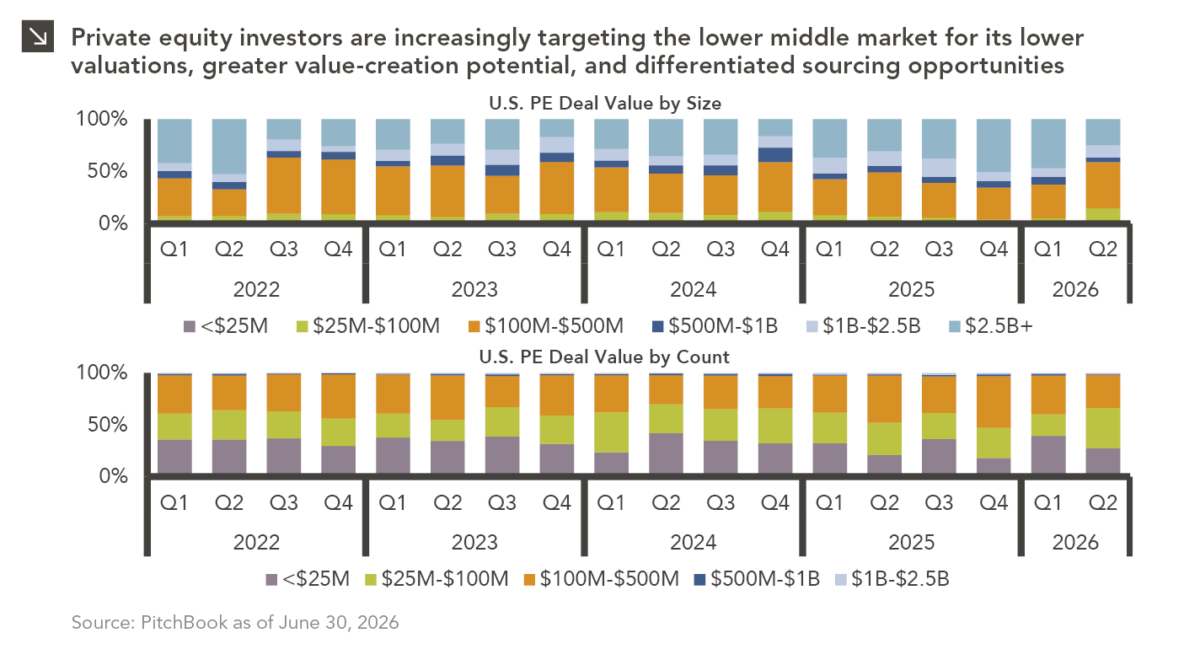
Stacked bar chart showing U.S. private equity deal value by deal size from Q1 2022 through Q2 2026. The y-axis shows percentage of total deal value from 0% to 100%, and the x-axis shows quarters by year. Stacked bar chart showing the percentage of U.S. private equity deal count by deal size from Q1 2022 through Q2 2026. The y-axis ranges from 0% to 100%, and the x-axis shows quarters by year. For full dataset, please contact marquettemarketing@marquetteassociates.com.

10.26.2026

Smaller Deals, Larger Appeal

Private equity activity is increasingly shifting toward smaller transactions, with total deal value for transactions of $100 million or less…

10.08.2026

3Q 2026 Market Insights

This video is a recording of a live webinar held October 22 by Marquette’s research team analyzing the third quarter…
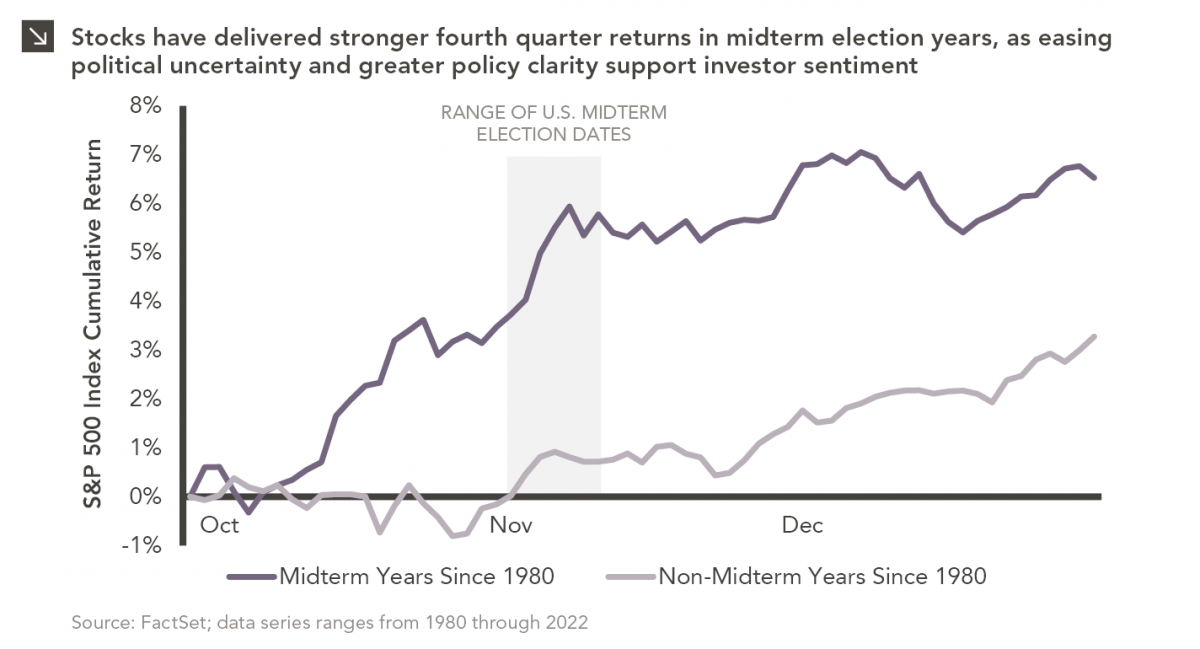
Line chart comparing S&P 500 Index cumulative returns for midterm and non-midterm election years since 1980. The x-axis shows October through December, and the y-axis shows S&P 500 Index cumulative return, ranging from -1% to 8%. For full dataset, please contact marquettemarketing@marquetteassociates.com.

10.19.2026

Divided We Rise?

Since 1980, the S&P 500 Index has generally performed well in the weeks surrounding U.S. midterm elections. Specifically, the index…
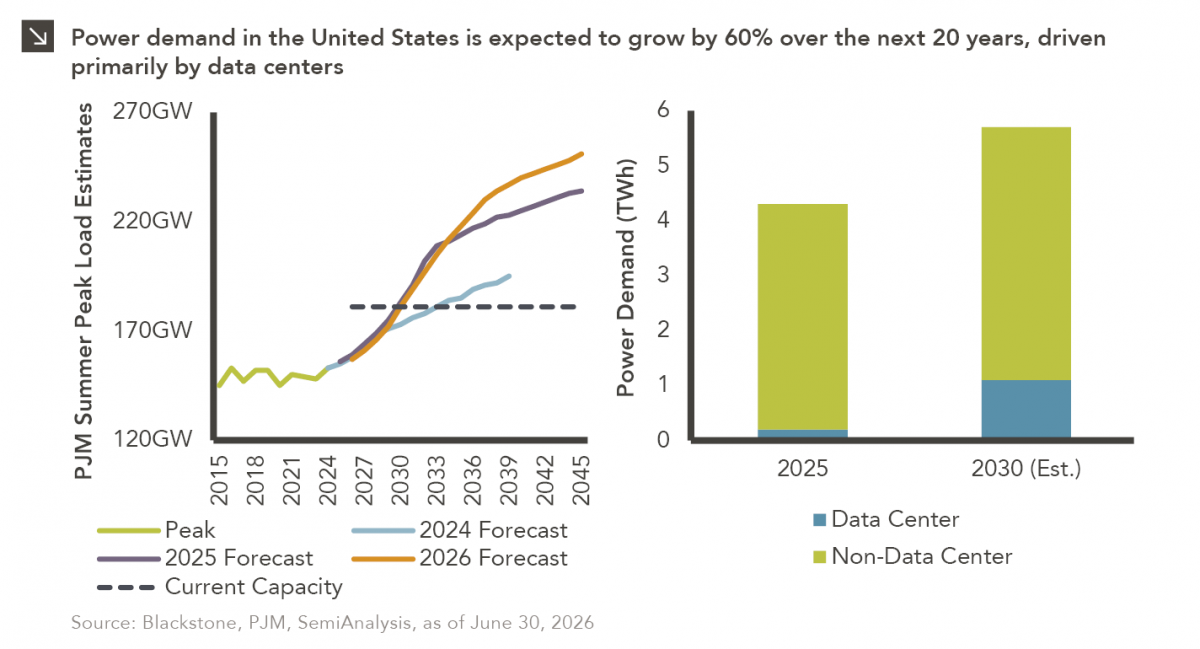
Chart #1 - Line chart showing PJM summer peak load estimates in gigawatts (GW) from 2015 to 2045. The chart compares historical peak load, current capacity, and forecasts from 2024, 2025, and 2026, showing projected demand rising above current capacity over time. Chart #2 - Stacked bar chart showing U.S. power demand in terawatt-hours (TWh) for 2025 and estimated demand in 2030. The chart compares data center and non-data center demand, showing total power demand increasing over the period.

10.12.2026

The Power Demand Supercycle

This week’s chart highlights the accelerating growth of electricity demand in the U.S., which has been driven primarily by the…

More articles

Subscribe to Research Email Alerts

Research Email Alert Subscription

Research alerts keep you updated on our latest research publications. Simply enter your contact information, choose the research alerts you would like to receive and click Subscribe. Alerts will be sent as research is published.

We respect your privacy. We will never share or sell your information.

Thank You

We appreciate your interest in Marquette Associates.

If you have questions or need further information, please contact us directly and we will respond to your inquiry within 24 hours.

Contact Us >