Nat Kellogg, CFA
President


Venture-backed companies tend to be nascent and typically deploy investment capital in an effort to drive revenue expansion, often to a point at which they are losing money. Given this profile, these businesses must raise new capital every few years to fund future growth. In normal circumstances, each capital raise is conducted at a higher valuation, assuming the company remains financially viable. That said, there are occasionally instances in which the market’s perception of valuation has materially changed or the company is not achieving specific growth targets. Cases like these, which are referred to as down rounds, result in companies being forced to raise capital at lower valuations than the ones exhibited during the most recent fundraising period.
Many venture-backed companies raised capital in 2020 and 2021 at relatively high valuations. Since that time, a significant portion of those companies have seen cash levels depleted and are now returning to the market in order to fund operations for the next few years. However, today’s market environment looks quite different from those of 2020 and 2021, which means these companies are being confronted with much lower valuations as they attempt to raise capital. As displayed in this week’s chart, these dynamics have led to a steady increase in the number of down rounds over the last several quarters. To that point, down rounds (as a percentage of all fundraising rounds) hit a new high of nearly 27% in the third quarter, which is more than double the long-term average.
The trends depicted in the chart above are likely to lead to some disappointing returns for venture capital funds with vintages from 2018 through 2021, as these funds deployed significant amounts of capital during those years and now face a more challenged valuation landscape. On the bright side, these dynamics may present an opportunity for funds with more recent vintages and fresh capital to invest at more attractive valuation levels. Marquette will continue to monitor developments within the venture capital space and provide recommendations to clients related to existing exposures and future commitments.
Print PDF
The opinions expressed herein are those of Marquette Associates, Inc. (“Marquette”), and are subject to change without notice. This material is not financial advice or an offer to purchase or sell any product. Marquette reserves the right to modify its current investment strategies and techniques based on changing market dynamics or client needs.

07.07.2026
JULY 23 — 1:00pm CT Please join Marquette’s research team for our 2026 Halftime Market Insights Webinar…
07.06.2026
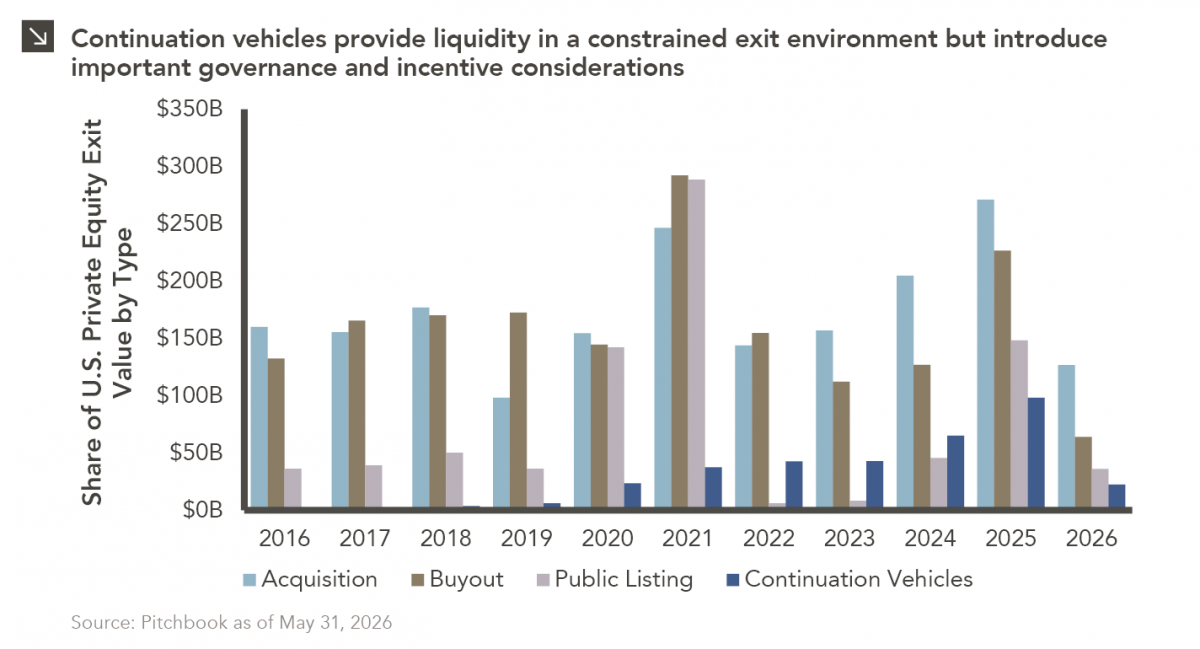
Since traditional exit routes have remained constrained in recent years due to higher interest rates, valuation gaps, and a subdued…
06.29.2026
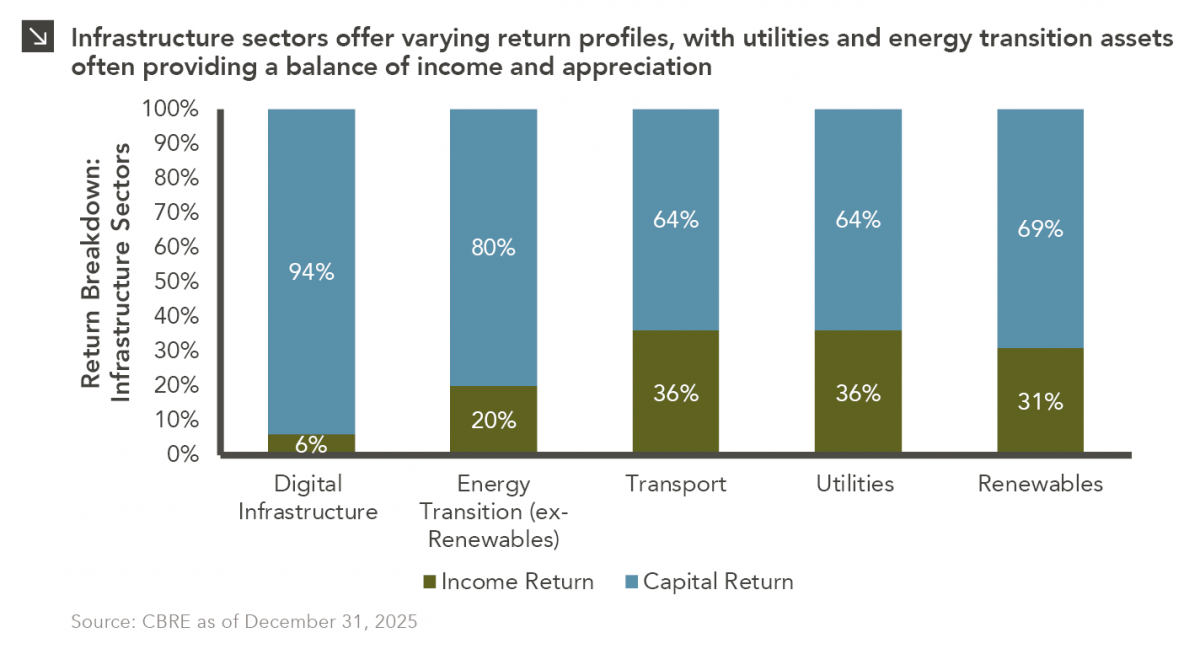
This week’s chart highlights the varying return profiles across key infrastructure sectors by illustrating the split between income and capital…
06.22.2026
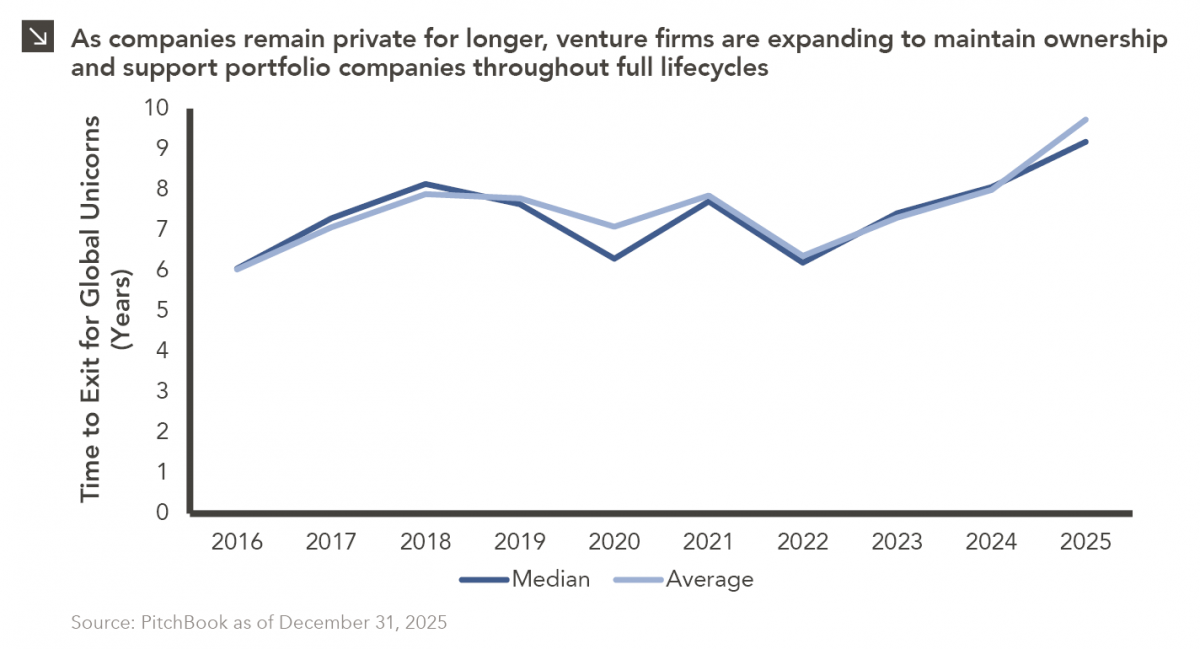
When Benchmark, one of Silicon Valley’s most renowned early-stage venture capital firms, closed $2 billion across two new funds this…
06.15.2026
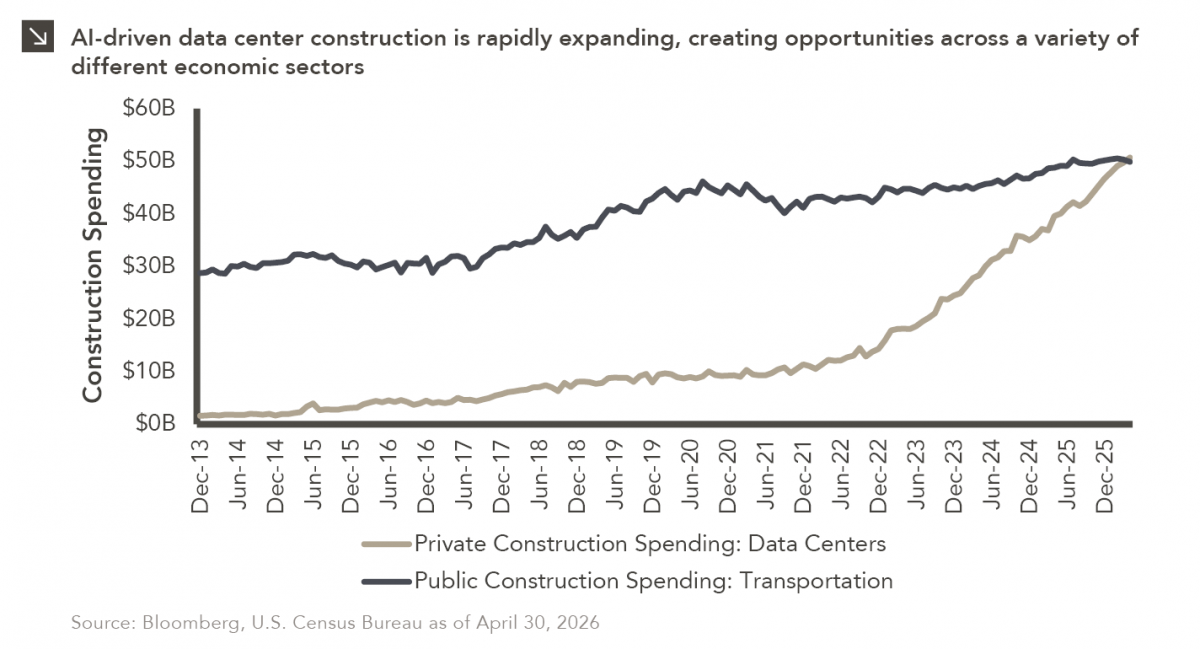
The rapid buildout of artificial intelligence infrastructure is reshaping the U.S. investment landscape. According to recent Census Bureau data, spending…
06.08.2026
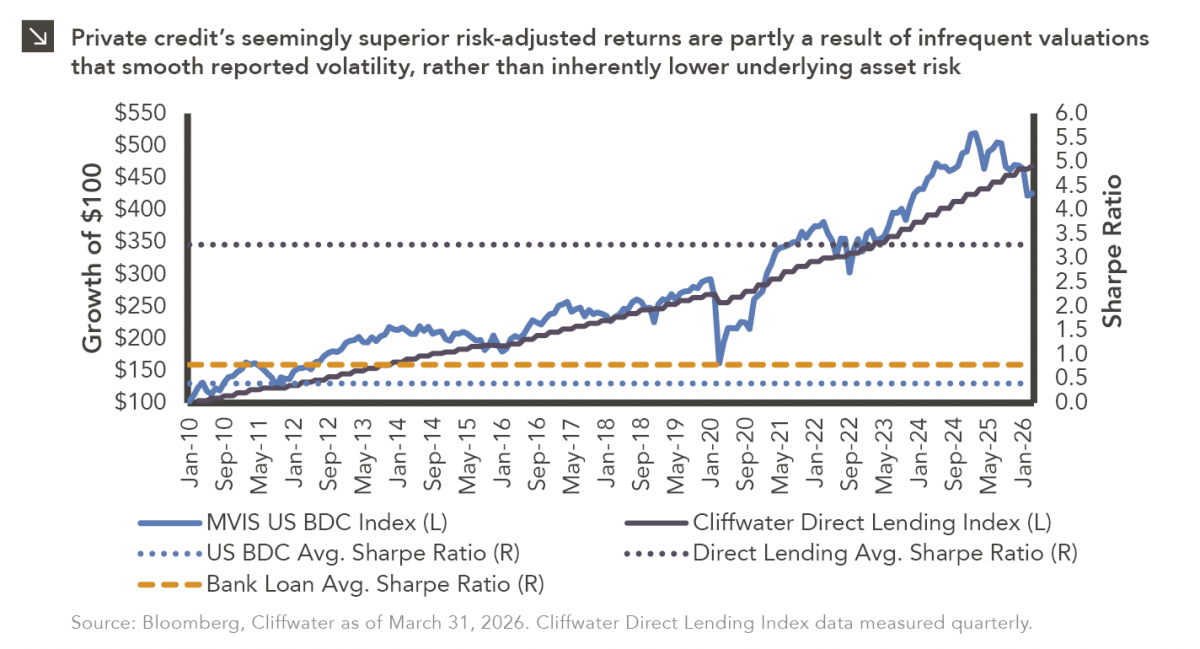
Hi, James Torgerson here! Volatility can be an unsightly blemish on portfolios and lead to inferior risk-adjusted returns. Private credit…
Research alerts keep you updated on our latest research publications. Simply enter your contact information, choose the research alerts you would like to receive and click Subscribe. Alerts will be sent as research is published.
We respect your privacy. We will never share or sell your information.
If you have questions or need further information, please contact us directly and we will respond to your inquiry within 24 hours.
Contact Us >