Eddie Arrieta
Associate Research Analyst
Get to Know Eddie


A key metric that many investors use to measure the size of a company is market capitalization, which represents the total number of a company’s outstanding shares multiplied by the current market price per share. U.S. Steel became the first company to cross the $1 billion market capitalization threshold when it went public in the early 1900s. The first company to reach $10 billion in market capitalization was General Motors in 1945, and General Electric passed the $100 billion mark roughly 50 years later. More recently, two mega-cap technology companies crossed the $1 trillion milestone. Apple was the first to accomplish this feat in 2018, having come a very long way from its market capitalization of around $2 billion at the time of its initial public offering during the 1980s. The second company to gain membership into the exclusive $1 trillion club was Microsoft in 2019. These two behemoths have continued to achieve new market capitalization milestones in recent time, with both surpassing the $3 trillion mark within the last year.
One notable fact related to these dynamics is that in 2023 both Apple and Microsoft became larger than the entire Russell 2000 Index, a market capitalization-weighted benchmark that tracks the U.S. small-cap universe. While this is in large part due to robust growth of these technology giants, poor performance from smaller companies in recent years has also given rise to the trends depicted in this week’s chart. All of this being said, recent pressure on Apple shares, in conjunction with a small-cap rally to close out last year, has led to Apple falling back below the $3 trillion mark and the Russell 2000 Index, which now sits at roughly $2.95 trillion in total market capitalization. It is possible that Microsoft will soon follow suit given concerns related to its potentially lofty valuation, as well as the relatively attractive multiples of small-cap equities in general.
Print PDF
The opinions expressed herein are those of Marquette Associates, Inc. (“Marquette”), and are subject to change without notice. This material is not financial advice or an offer to purchase or sell any product. Marquette reserves the right to modify its current investment strategies and techniques based on changing market dynamics or client needs.

08.31.2026
Private equity has always had a few portfolio companies that refused to leave the party. Today, however, the industry appears…

08.24.2026
The global bond market is facing renewed pressure as investors demand higher yields to hold long-dated government debt, pushing borrowing…

08.17.2026
As a college football player struggling to put on mass, the “supersizing” deal at McDonald’s was hard to beat. For…

08.10.2026
After reaching nearly ¥164 per dollar, its weakest level in roughly four decades, the yen had become a source of…

08.03.2026
In the cinematic masterpiece Rocky IV, Rocky gets dazed by his opponent, Captain Ivan Drago, and complains that he sees…
07.27.2026
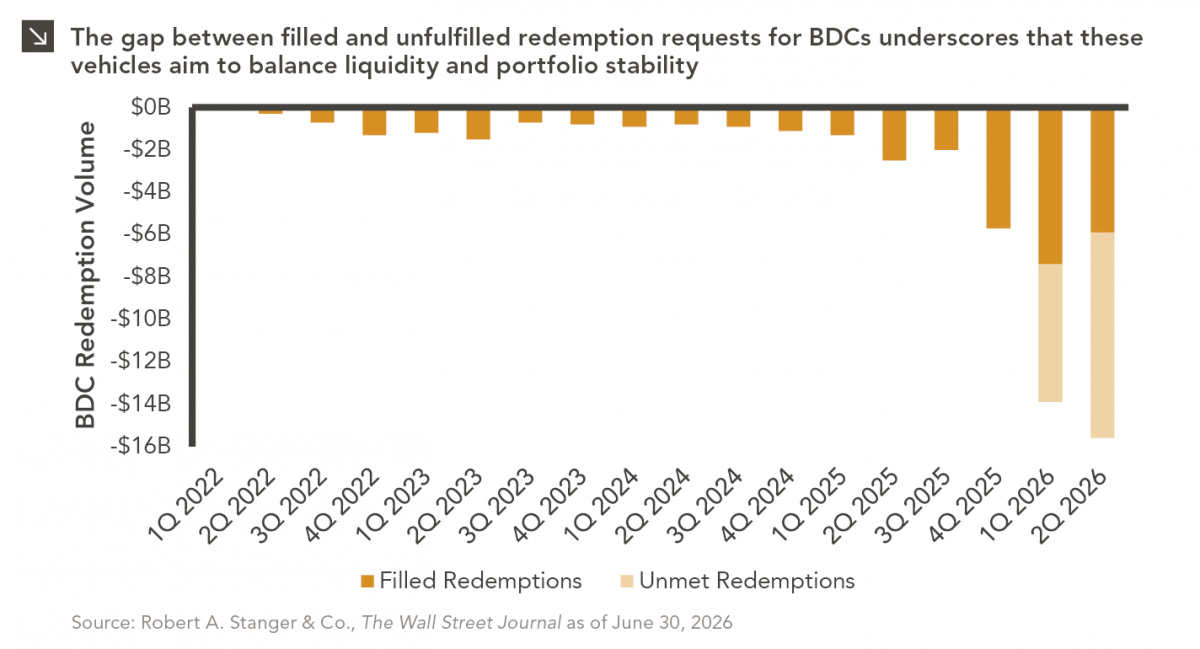
The rapid growth of non-traded business development companies (BDCs), which are investment vehicles that pool investor capital to make loans…
Research alerts keep you updated on our latest research publications. Simply enter your contact information, choose the research alerts you would like to receive and click Subscribe. Alerts will be sent as research is published.
We respect your privacy. We will never share or sell your information.
If you have questions or need further information, please contact us directly and we will respond to your inquiry within 24 hours.
Contact Us >