Amy Miller
Associate Director of Private Equity
There are multiple ways to gauge how private markets managers are performing, such as benchmarking returns relative to their peers within their respective vintage years. Net internal rate of return (“IRR”), total value to paid in capital (“TVPI”), and distributed to paid in capital (“DPI”) are measurements that are among the most common. DPI is calculated as a ratio of cash returned to cash paid by the investors and is the one metric of the three that cannot be manipulated via subjective valuations. This metric is also not impacted by time. In effect, DPI does not lie… Or does it?
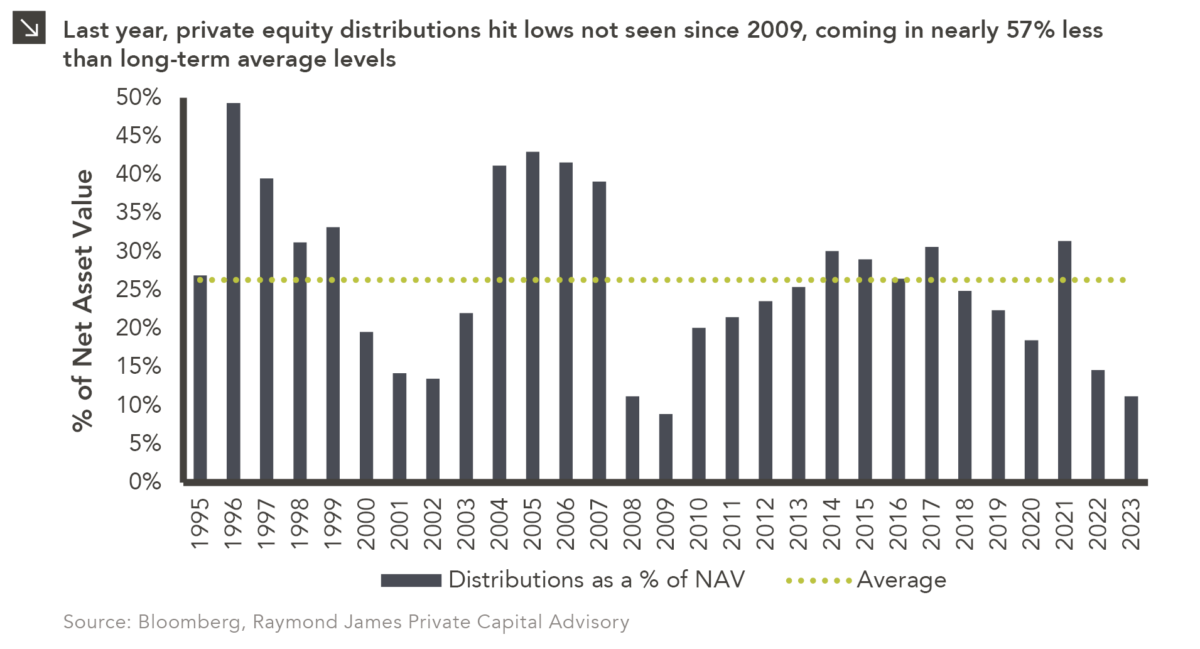
In 2023, distributions from private equity funds as a percentage of portfolio NAV stood at 11.2%, which represents the lowest figure since 2009. Given the slow exit environment over the past 18 months and the quick deployment pace of 2021 and 2022, many general partners are using creative methods to return capital to investors in advance of their next fundraise (absent a true exit). These methods include net asset value (or NAV) loans and continuation vehicles. Alternative methods of liquidity like these will engineer a boost in DPI in the short term but may increase risk and dampen overall returns as net capital outstanding contracts.
While deal activity remains depressed relative to 2021 and 2022, 2023 marked a return to normalcy relative to long-term average levels. This could mean that the pace of exits isn’t far behind, and DPI will remain private equity’s most veracious performance metric.
Print PDF
The opinions expressed herein are those of Marquette Associates, Inc. (“Marquette”), and are subject to change without notice. This material is not financial advice or an offer to purchase or sell any product. Marquette reserves the right to modify its current investment strategies and techniques based on changing market dynamics or client needs.

06.22.2026
When Benchmark, one of Silicon Valley’s most renowned early-stage venture capital firms, closed $2 billion across two new funds this…

06.15.2026
The rapid buildout of artificial intelligence infrastructure is reshaping the U.S. investment landscape. According to recent Census Bureau data, spending…

06.08.2026
Hi, James Torgerson here! Volatility can be an unsightly blemish on portfolios and lead to inferior risk-adjusted returns. Private credit…

06.01.2026
The MSCI Emerging Markets Index has undergone a significant structural transformation in recent years. For much of the past decade,…

05.26.2026
The classic novel A Tale of Two Cities by Charles Dickens begins with the line “It was the best of…

05.18.2026
Over the last few years, equity markets have been defined by a group of stocks often referred to as the…
Research alerts keep you updated on our latest research publications. Simply enter your contact information, choose the research alerts you would like to receive and click Subscribe. Alerts will be sent as research is published.
We respect your privacy. We will never share or sell your information.
If you have questions or need further information, please contact us directly and we will respond to your inquiry within 24 hours.
Contact Us >