Evan Frazier, CFA, CAIA
Senior Research Analyst


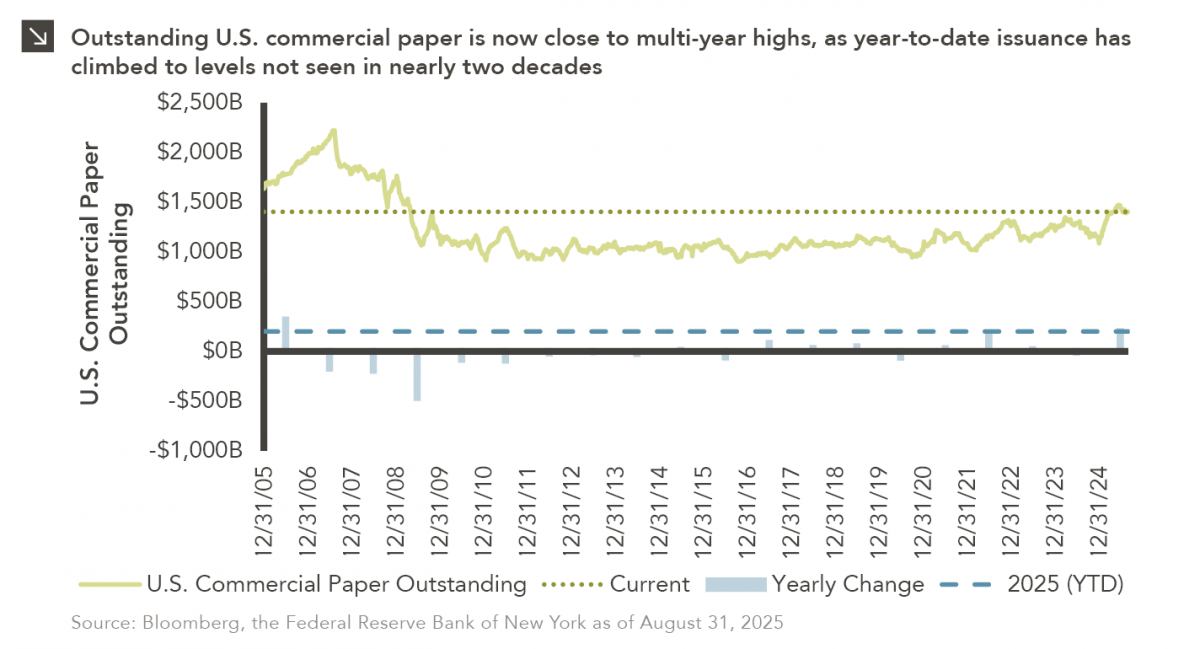
Commercial paper is a type of unsecured debt instrument that can be utilized by companies to finance short-term liabilities. The U.S. commercial paper market, which eclipsed $2 trillion in total value in 2007, was decimated in the aftermath of the Global Financial Crisis, with ultra-low interest rates pushing most companies toward longer-term obligations. That said, this method of financing is currently experiencing a revival, as 2025 has seen more than $200 billion in new U.S. commercial paper issuance. This is the highest figure notched in a calendar year since 2006. Indeed, major corporations including Uber, Netflix, Coca-Cola, PepsiCo, Philip Morris, and Honeywell have recently ventured into the commercial paper market, collectively raising billions through instruments that usually mature within one to three months. Total U.S. commercial paper outstanding stood at more than $1.4 trillion at the end of August.
The recent growth of the commercial paper market reflects a notable change in how U.S. companies are choosing to finance operations. With borrowing costs elevated and trade tensions persisting, firms have opted to bolster cash reserves while avoiding the higher expense of long-term debt, particularly as potential interest rate cuts from Federal Reserve loom. This trend is consistent with the approach of the U.S. Department of the Treasury, which has relied heavily on short-term T-bill issuance to cover government funding needs. It is important to note, however, that commercial paper utilization exposes issuers to certain risks. For instance, if long-term interest rates remain high, companies could be forced to regularly roll over short-dated obligations. A surge in short-term borrowing by both businesses and the government may also increase competition for investors, raising funding costs further.
Print PDF
The opinions expressed herein are those of Marquette Associates, Inc. (“Marquette”), and are subject to change without notice. This material is not financial advice or an offer to purchase or sell any product. Marquette reserves the right to modify its current investment strategies and techniques based on changing market dynamics or client needs.

09.21.2026
For much of the past several years, the conventional view has been that higher interest rates and stretched valuations would…

09.14.2026
There are many great things about working at Marquette Associates, but “Free Lunch Tuesday” is right at the top of…

09.08.2026
Over the last several years, emerging market debt (EMD) has faced several headwinds, with rising yields across other fixed income…

08.31.2026
Private equity has always had a few portfolio companies that refused to leave the party. Today, however, the industry appears…

08.24.2026
The global bond market is facing renewed pressure as investors demand higher yields to hold long-dated government debt, pushing borrowing…

08.17.2026
As a college football player struggling to put on mass, the “supersizing” deal at McDonald’s was hard to beat. For…
Research alerts keep you updated on our latest research publications. Simply enter your contact information, choose the research alerts you would like to receive and click Subscribe. Alerts will be sent as research is published.
We respect your privacy. We will never share or sell your information.
If you have questions or need further information, please contact us directly and we will respond to your inquiry within 24 hours.
Contact Us >