09.08.2026
EMD’s Second Chance?
Over the last several years, emerging market debt (EMD) has faced several headwinds, with rising yields across other fixed income…


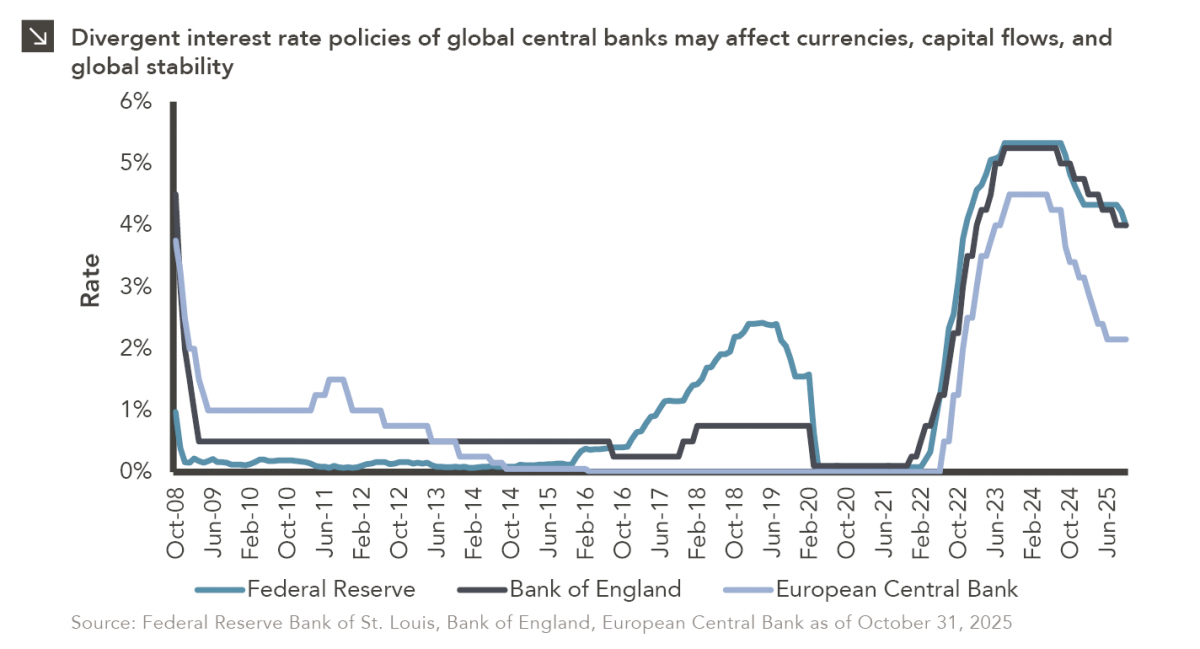
After a largely synchronized hiking cycle beginning in 2022, there has been a slight divergence in interest rate policies across the Federal Reserve, European Central Bank, and Bank of England in recent time. Both the ECB and BoE initiated their easing cycles in the middle of last year, ahead of the Fed, which has since followed suit with its latest rate cut coming last month. The target range for the effective federal funds rate is now 3.75– 4.00%. The policy rate of the BoE also hovers near 4% following its August 2025 cut, and the central bank is expected to maintain this positioning through November. Meanwhile, the latest rate reduction by the ECB in June has brought its policy rate down to roughly 2.2% given the relatively weaker growth and lower inflationary pressures faced by the euro area.
While it is critical for central banks to maintain independent monetary policies tailored to the conditions of their respective economies, disparate rate regimes across the developed world could have significant implications. For instance, global currency markets remain highly sensitive to interest rate differentials, and currency movements can meaningfully shift trade balances since goods from the country with the stronger currency become more expensive abroad. Additionally, investors may redirect capital toward regions with higher yields, impacting security prices and creating volatility in global financial markets as funds move across borders. In conclusion, if these central banks opt for different policy paths going forward, an additional layer of uncertainty will likely be added to the broader economic outlook.
Print PDFThe opinions expressed herein are those of Marquette Associates, Inc. (“Marquette”), and are subject to change without notice. This material is not financial advice or an offer to purchase or sell any product. Marquette reserves the right to modify its current investment strategies and techniques based on changing market dynamics or client needs.

09.08.2026
Over the last several years, emerging market debt (EMD) has faced several headwinds, with rising yields across other fixed income…

08.31.2026
Private equity has always had a few portfolio companies that refused to leave the party. Today, however, the industry appears…

08.24.2026
The global bond market is facing renewed pressure as investors demand higher yields to hold long-dated government debt, pushing borrowing…

08.17.2026
As a college football player struggling to put on mass, the “supersizing” deal at McDonald’s was hard to beat. For…

08.10.2026
After reaching nearly ¥164 per dollar, its weakest level in roughly four decades, the yen had become a source of…

08.03.2026
In the cinematic masterpiece Rocky IV, Rocky gets dazed by his opponent, Captain Ivan Drago, and complains that he sees…
Research alerts keep you updated on our latest research publications. Simply enter your contact information, choose the research alerts you would like to receive and click Subscribe. Alerts will be sent as research is published.
We respect your privacy. We will never share or sell your information.
If you have questions or need further information, please contact us directly and we will respond to your inquiry within 24 hours.
Contact Us >