Evan Frazier, CFA, CAIA
Senior Research Analyst


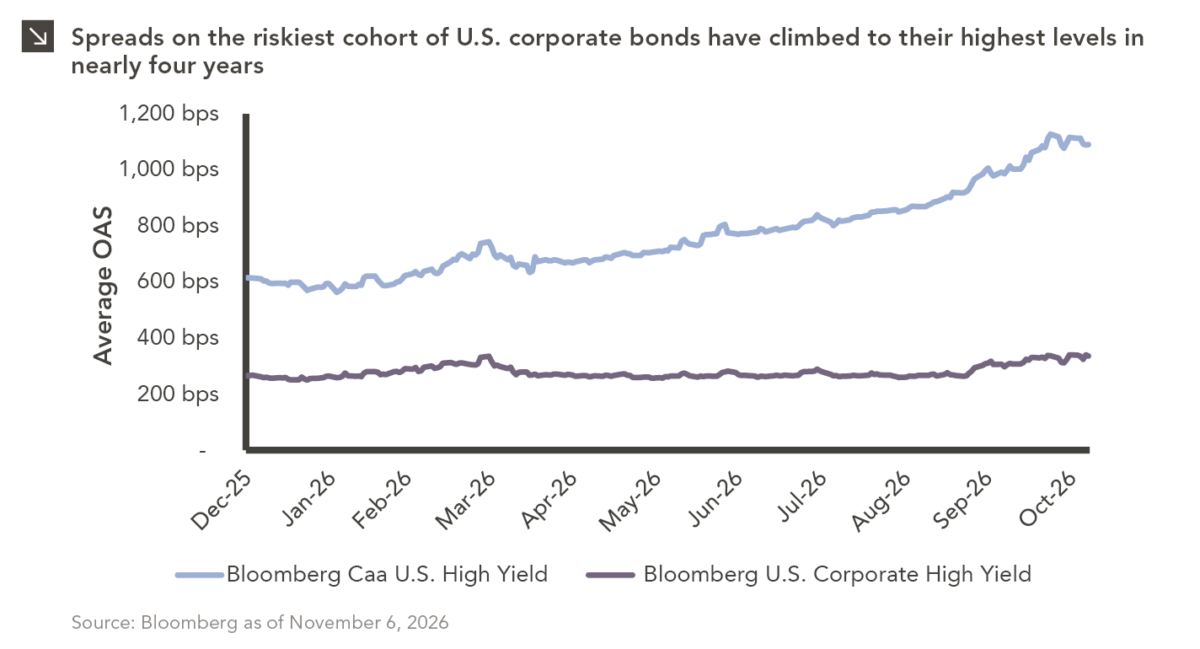
The U.S. distressed debt market is showing increasingly pronounced signs of stress. As of this writing, option-adjusted spreads on CCC-rated U.S. high yield bonds, the riskiest segment of the speculative-grade market, sat above 1,000 basis points, which represents the most extreme level this cohort has exhibited since the March 2023 regional banking crisis. The CCC segment of the high yield market has returned -5.4% since the end of June, compared to -1.1% for the Bloomberg U.S. High Yield Index. It is worth noting that this deterioration extends beyond publicly traded bonds, as the volume of leveraged loans trading at distressed prices (i.e., below 80 cents on the dollar) climbed to approximately $140 billion in October, nearly 90% higher than a year earlier and approaching levels last seen during the COVID-19 pandemic. More severely impaired loans, or those trading below 60 cents on the dollar, totaled approximately $65 billion last month, which represents the highest level since March 2020.
Several factors are likely contributing to these dynamics. First, elevated interest rates are putting pressure on highly leveraged companies, particularly those with floating-rate debt or significant refinancing requirements. These borrowing costs are increasingly difficult to absorb for businesses with limited free cash flow, and a more cautious lending environment has made the refinancing of existing obligations more challenging. Recent market stress could also be a function of adversarial dynamics between borrowers and creditors. Companies with viable refinancing options continue to benefit from strong technical demand for traditional high yield debt and are supported by institutional investors (e.g., insurance companies and pension funds) seeking attractive yields. However, issuers with more limited refinancing options face a much more challenging environment, as creditors increasingly fear borrower-led liability management exercises that could disadvantage certain creditor groups through maturity extensions, selective repayments, or other restructuring tactics. Additionally, investors are increasingly questioning whether technology-oriented businesses can maintain competitive positions and cash flows as artificial intelligence adoption accelerates. Estimates indicate technology companies account for nearly 40% of distressed leveraged loan volume, with software borrowers facing particular scrutiny given the potential for AI-driven disruption and more than $100 billion in upcoming debt maturities. At the same time, the rapid expansion of AI infrastructure has raised concerns about the sustainability of debt-financed capital expenditures. Finally, broader market conditions have added to the pressures within the distressed space, with persistent inflation and a surge in corporate borrowing (including several exceptionally large debt transactions) contributing to greater investor selectivity and wider credit risk premiums.
For investors, the developments detailed above present both a warning about deteriorating credit conditions and a potential source of opportunity. Companies that accumulated substantial leverage when financing was inexpensive may face increasingly difficult choices as debt matures, including refinancing at materially higher rates, asset sales, liability management exercises, or, ultimately, restructuring and bankruptcy. Importantly, the widening in CCC spreads should not necessarily be interpreted as evidence of an imminent broad-based credit crisis, as deterioration remains relatively concentrated among weaker issuers and industries facing structural challenges. To that point, estimates indicate that roughly 20% of the CCC bond index was trading below 60 cents on the dollar in early October, while the remaining, more fundamentally sound portion of the CCC market exhibited considerably more normal spread levels. This distinction is important for investors. While broad exposure to the lowest-rated credit segments carries meaningful downside risk, dispersion across issuers creates opportunities for asset managers with the resources to underwrite individual capital structures, assess recovery prospects, and distinguish temporary headwinds from permanent impairments. For distressed and opportunistic credit strategies, an expanding universe of dislocated securities could create attractive entry points, particularly where market pricing discounts a more severe restructuring outcome than ultimately materializes. However, investors must remain cognizant of potentially lower recovery values, increasingly complex creditor negotiations, and the possibility that current challenges could develop into a more pronounced default cycle.
Print PDF
The opinions expressed herein are those of Marquette Associates, Inc. (“Marquette”), and are subject to change without notice. This material is not financial advice or an offer to purchase or sell any product. Marquette reserves the right to modify its current investment strategies and techniques based on changing market dynamics or client needs.
11.02.2026
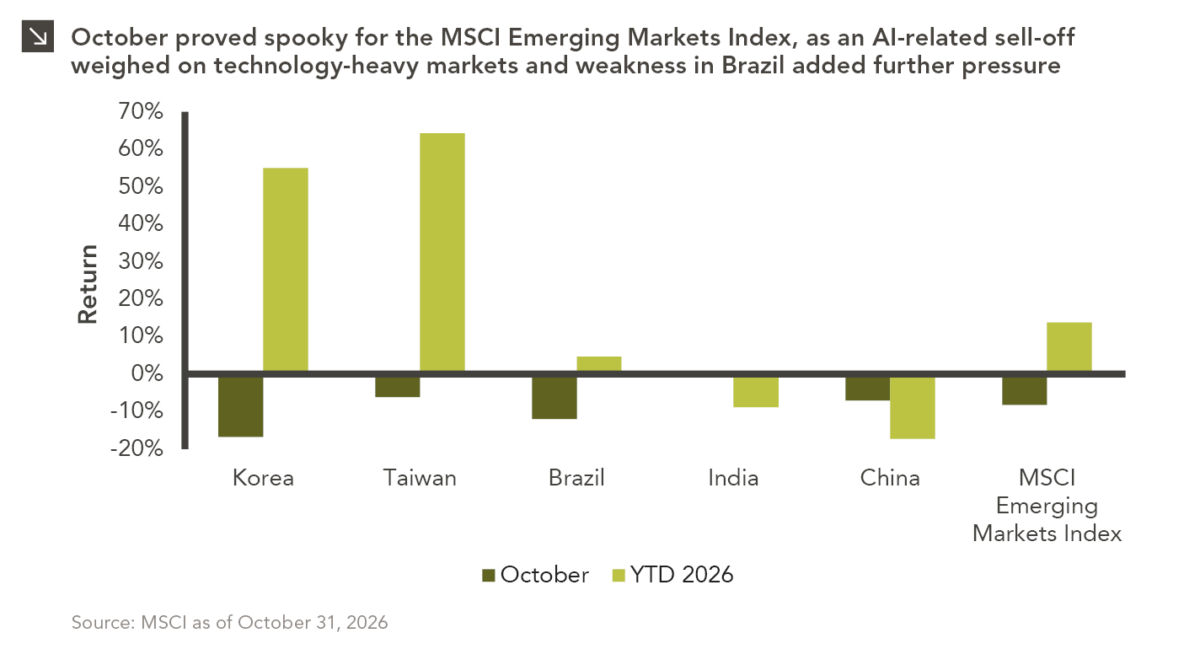
Emerging markets faced a challenging October, with the space declining by around 8.3% amid renewed concerns over the sustainability of…
10.26.2026
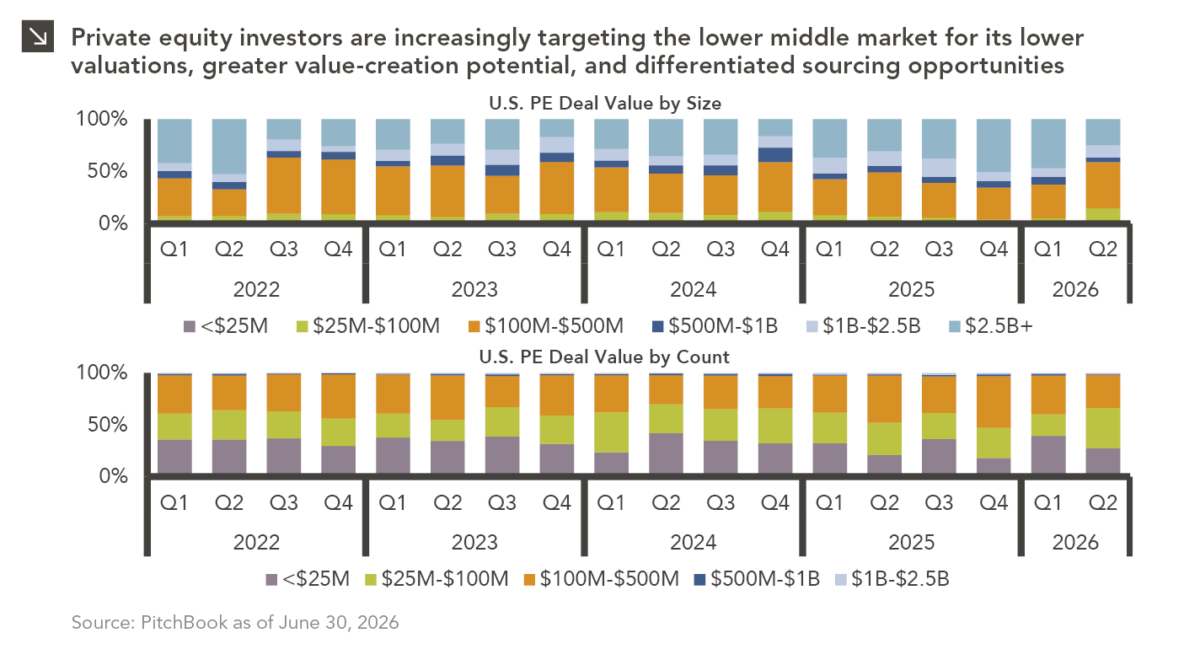
Private equity activity is increasingly shifting toward smaller transactions, with total deal value for transactions of $100 million or less…

10.08.2026
This video is a recording of a live webinar held October 22 by Marquette’s research team analyzing the third quarter…

10.22.2026
Anyone who has run a marathon knows the last six miles are brutal — no matter how well the first…
10.19.2026
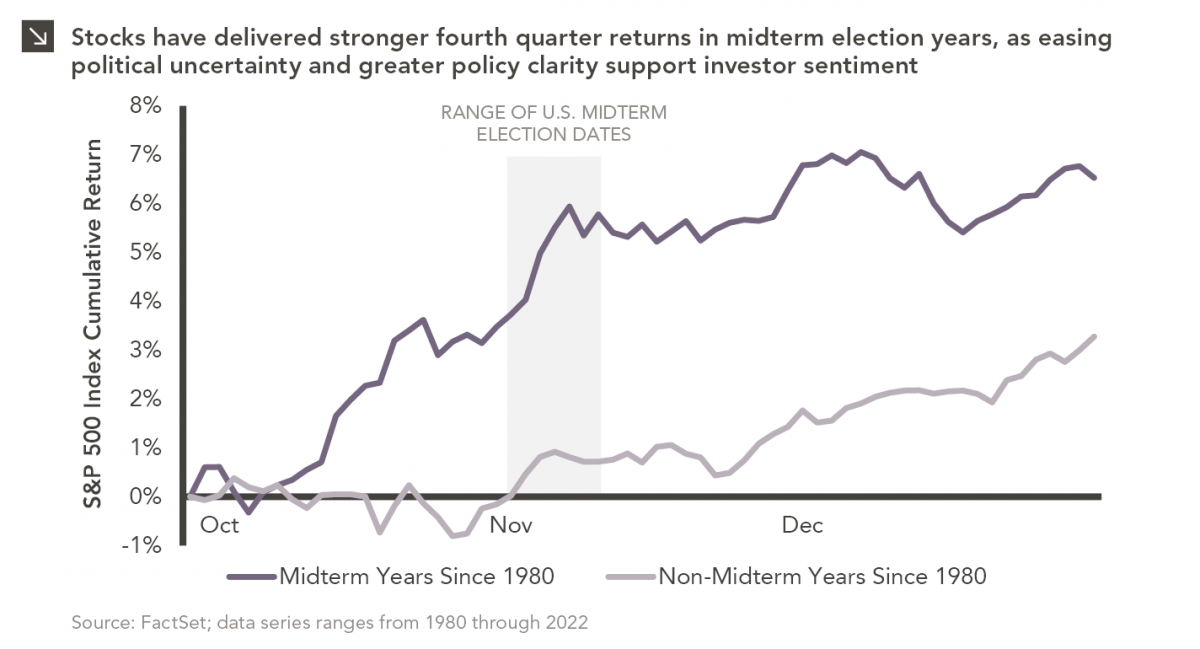
Since 1980, the S&P 500 Index has generally performed well in the weeks surrounding U.S. midterm elections. Specifically, the index…
10.12.2026
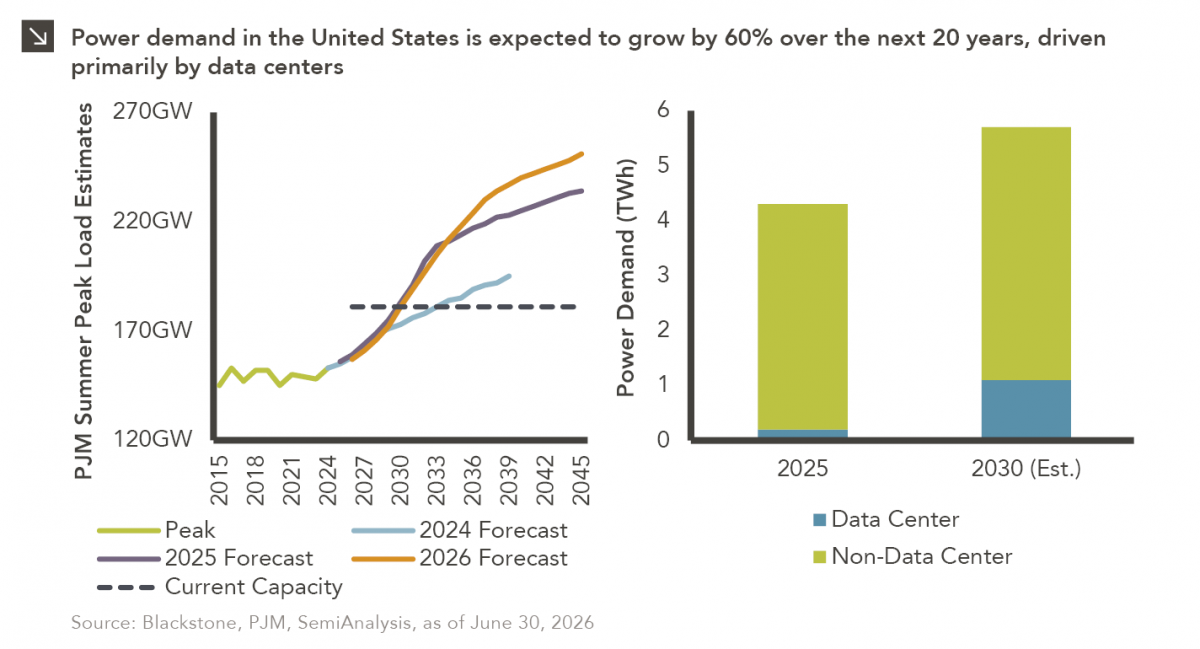
This week’s chart highlights the accelerating growth of electricity demand in the U.S., which has been driven primarily by the…
Research alerts keep you updated on our latest research publications. Simply enter your contact information, choose the research alerts you would like to receive and click Subscribe. Alerts will be sent as research is published.
We respect your privacy. We will never share or sell your information.
If you have questions or need further information, please contact us directly and we will respond to your inquiry within 24 hours.
Contact Us >