Frank Valle, CFA, CAIA
Associate Director of Fixed Income


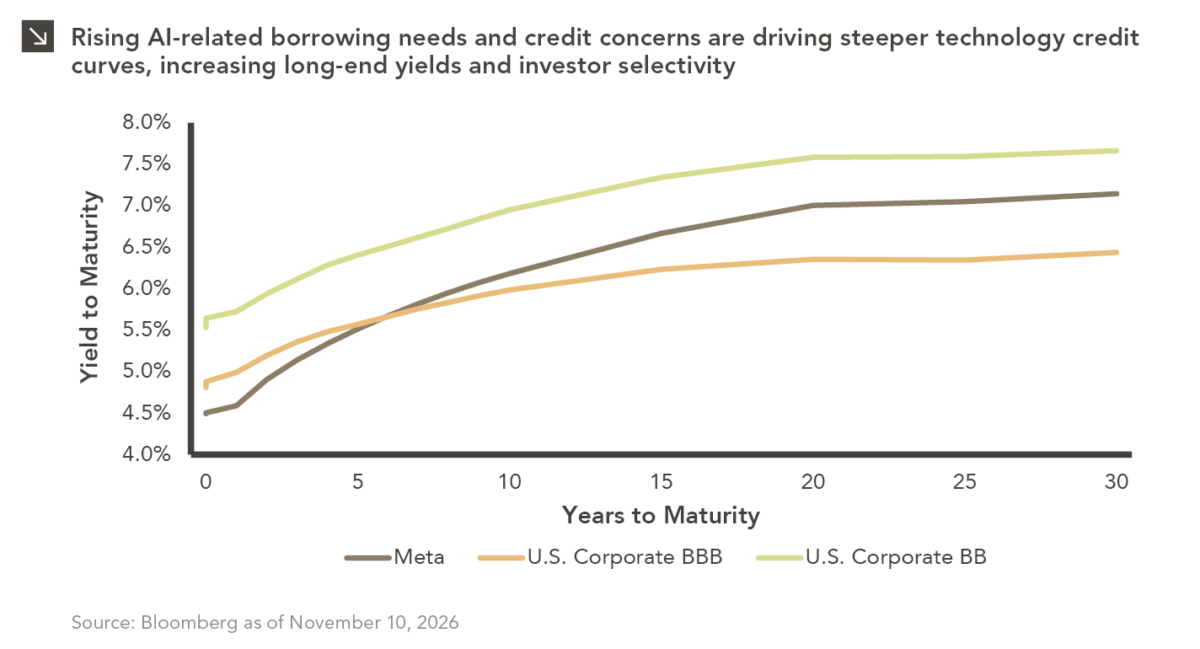
Corporate bond spreads are not homogeneous, meaning they are rarely consistent across the yield curve. For instance, the Meta curve spans roughly 240 basis points of option-adjusted steepness from its front end (41 basis points at 1 year) to its long end (282 basis points at 40 years). As an AA-rated credit, Meta trades inside the BBB (i.e., the lowest investment grade rating) curve at maturities of less than 6 years but approaches the BB (i.e., the highest high yield rating) curve at longer maturities. Said another way, the investment grade “business” of the front end gives way to the high yield “party” in the back end.
There are several factors that explain the shape of Meta’s yield curve, one of which is supply related. Meta has issued bonds at an extraordinary pace this year, and this new issuance has extended the company’s weighted-average maturity to nearly 20 years and lifted its public debt to roughly $84 billion. To clear the primary market, Meta issued at a weighted-average coupon of nearly 5.2%, which is above those of its peers (e.g., Amazon, Microsoft, and Alphabet). Just last week, Meta raised $15 billion in U.S. dollars and an additional €9 billion in euros, paying significantly larger new issue concessions than peers and pricing new long-dated bonds wide of its existing secondary curve. The fact that investors have been actively reducing their long-end technology exposure is another factor that has contributed to curve steepness for Meta. As investors have become more selective with their AI exposures and long-end bonds have underperformed, larger concessions and greater funding transparency for new issuances have been required. Fundamental factors are also driving the steepness of the Meta curve. For instance, S&P Global cut its outlook for Meta to negative at the end of last month due to uncertainty about elevated spending, negative free operating cash flow, and the risk of leverage moving higher. These dynamics have contributed to a widening of Meta’s CDS spread by more than 20 basis points over the last 12 months. Additionally, the bond issued to fund Meta’s data center project in Louisiana has traded down in recent time amid concerns about the company’s growing debt load and financing needs. Finally, it is worth noting that longer-dated bonds are generally more sensitive to credit deterioration, which causes the investors in that segment of the market to demand a more significant risk premium.
While the Meta curve is commonly cited, this pattern is not Meta-specific. Going forward, investors should expect continued dispersion and potentially steeper credit curves across the investment grade technology sector as elevated AI-related capital expenditures drive higher borrowing needs and greater scrutiny of balance sheet fundamentals. While this may create opportunities to capture incremental yield at the long end, investors should remain selective given the heightened sensitivity of longer-dated bonds to leverage, cash flow deterioration, and changing investor sentiment toward AI-related credit exposure.
Print PDF
The opinions expressed herein are those of Marquette Associates, Inc. (“Marquette”), and are subject to change without notice. This material is not financial advice or an offer to purchase or sell any product. Marquette reserves the right to modify its current investment strategies and techniques based on changing market dynamics or client needs.

11.09.2026
The U.S. distressed debt market is showing increasingly pronounced signs of stress. As of this writing, option-adjusted spreads on CCC-rated…

11.02.2026
Emerging markets faced a challenging October, with the space declining by around 8.3% amid renewed concerns over the sustainability of…

10.26.2026
Private equity activity is increasingly shifting toward smaller transactions, with total deal value for transactions of $100 million or less…

10.08.2026
This video is a recording of a live webinar held October 22 by Marquette’s research team analyzing the third quarter…

10.22.2026
Anyone who has run a marathon knows the last six miles are brutal — no matter how well the first…

10.19.2026
Since 1980, the S&P 500 Index has generally performed well in the weeks surrounding U.S. midterm elections. Specifically, the index…
Research alerts keep you updated on our latest research publications. Simply enter your contact information, choose the research alerts you would like to receive and click Subscribe. Alerts will be sent as research is published.
We respect your privacy. We will never share or sell your information.
If you have questions or need further information, please contact us directly and we will respond to your inquiry within 24 hours.
Contact Us >