10.19.2026
Divided We Rise?
Since 1980, the S&P 500 Index has generally performed well in the weeks surrounding U.S. midterm elections. Specifically, the index…


Over the past two decades there has been a steady decline in the number of companies listed on U.S. stock exchanges. In 1996, during the dot-com peak there were more than 8,000 public companies, but this has declined to just over 4,300 as increased regulation and consolidation has more than offset the number of IPOs and corporate spinouts. Over 2,000 companies were delisted between 1997-2003 as the maturity, composition, and fundamentals of these businesses were not able to attract institutional capital and thus failed to meet the listing standards of U.S. exchanges.
Meanwhile, the perception of the private equity industry continues to evolve as more capital and managers gravitate towards the space. There are over 7 million businesses in the U.S. and the number of private equity-backed companies has steadily increased to now over 7,100 companies. Investors continue to be attracted to the return potential, alignment, and innovation within the private markets. With nearly $1 trillion of dry powder in the private equity industry and near record fundraising we are almost certain to see the number of private equity-backed companies increase over the next decade.
Furthermore, it will not be surprising to see investors shift more of their allocations into private equity. Private markets offer a larger and growing opportunity set, and further upside than the fully valued equity markets. With both the number of managers and investment options increasing, we are likely to see a widening range of returns produced by the industry which will make manager selection even more critical for investors.
The opinions expressed herein are those of Marquette Associates, Inc. (“Marquette”), and are subject to change without notice. This material is not financial advice or an offer to purchase or sell any product. Marquette reserves the right to modify its current investment strategies and techniques based on changing market dynamics or client needs.
The opinions expressed herein are those of Marquette Associates, Inc. (“Marquette”), and are subject to change without notice. This material is not financial advice or an offer to purchase or sell any product. Marquette reserves the right to modify its current investment strategies and techniques based on changing market dynamics or client needs.

10.19.2026
Since 1980, the S&P 500 Index has generally performed well in the weeks surrounding U.S. midterm elections. Specifically, the index…

10.12.2026
This week’s chart highlights the accelerating growth of electricity demand in the U.S., which has been driven primarily by the…

10.08.2026
LIVE WEBINAR — OCTOBER 22 Please join Marquette’s research team for our 3Q 2026 Market Insights Webinar…

10.05.2026
For investors, the spookiest thing about October might not be the ghosts and monsters that are bound to show up…

09.28.2026
The phrase “expectations of higher inflation” has become a staple in financial news to explain the increase in nominal U.S….
09.21.2026
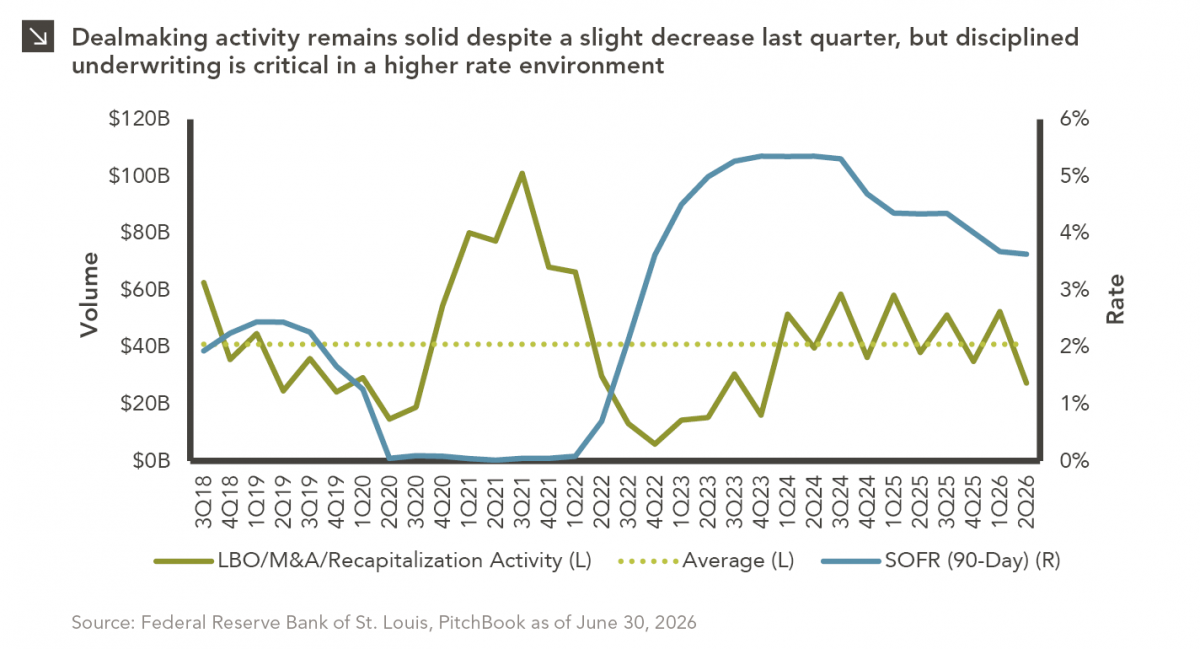
For much of the past several years, the conventional view has been that higher interest rates and stretched valuations would…
Research alerts keep you updated on our latest research publications. Simply enter your contact information, choose the research alerts you would like to receive and click Subscribe. Alerts will be sent as research is published.
We respect your privacy. We will never share or sell your information.
If you have questions or need further information, please contact us directly and we will respond to your inquiry within 24 hours.
Contact Us >