Neil S. Capps, CAIA, FDP
Partner, Director of Client Service


U.S. crude oil production peaked in November 1970 at just over 10 million barrels per day. That record stood until this year, when U.S. production surpassed its previous high, and with OPEC’s recent decision to keep production constant, there are perhaps more opportunities for additional U.S. production to fill in the demand gap. As a matter of background, petroleum is the sum of crude oil (used for gasoline, jet fuel, diesel, and heavy applications such as asphalt and tar) and hydrocarbon liquids (most common examples are natural gas, propane, and butane).
Natural gas drilling has increased substantially since the passing of the Energy Policy Act (“EPAct”) of 2005 and has been a significant driver of the increase in petroleum production and exports. Furthermore, this legislation loosened regulation and put incentives in place to drive growth in crude oil and natural gas production in the United States, with the goals of reducing reliance on foreign sources and providing a buffer against high energy costs. This has driven 7.4% and 5.7% annualized growth of U.S. natural gas and crude oil production over the past 13 years, respectively. Historically crude oil production has driven overall petroleum output for the United States, but since the EPAct of 2005, natural gas has had a significant influence on the domestic energy markets. Natural gas’ share of the overall U.S. petroleum output has risen from 15.4% in January 1973 to 28.9% in June 2018.
Overall U.S. petroleum production has increased by roughly 8,000 barrels per day since the passing of the EPAct of 2005, resulting in a 519.6% increase in U.S. petroleum exports, and a 23.1% decrease in U.S. petroleum imports over the same period. With Brent Crude oil exceeding $80 per barrel in September, the active count of U.S. rigs is likely to increase as greater profit opportunities return to the petroleum market.
The opinions expressed herein are those of Marquette Associates, Inc. (“Marquette”), and are subject to change without notice. This material is not financial advice or an offer to purchase or sell any product. Marquette reserves the right to modify its current investment strategies and techniques based on changing market dynamics or client needs.
The opinions expressed herein are those of Marquette Associates, Inc. (“Marquette”), and are subject to change without notice. This material is not financial advice or an offer to purchase or sell any product. Marquette reserves the right to modify its current investment strategies and techniques based on changing market dynamics or client needs.

10.27.2025
To paraphrase a quote from former President George W. Bush: “Fool me once, shame on… shame on you. Fool me…

10.22.2025
This video is a recording of a live webinar held October 22 by Marquette’s research team analyzing the third quarter…
10.22.2025
I spent the past weekend at my alma mater to watch them play their biggest rival. Football weekends there are…

10.20.2025
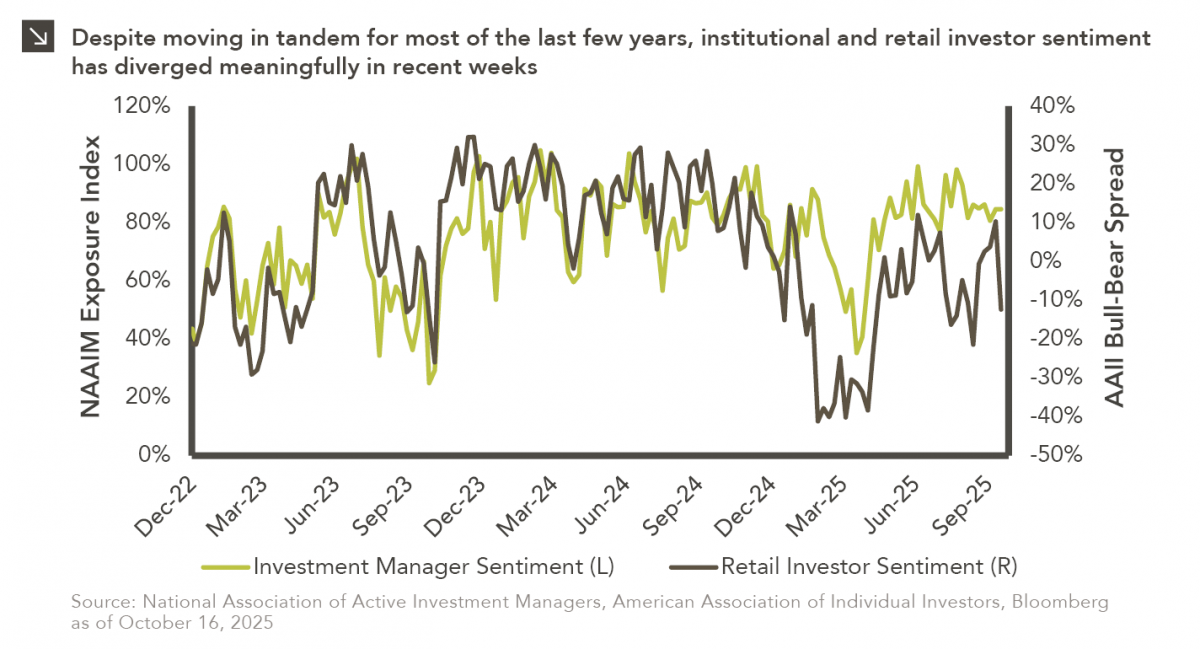
This week’s chart compares institutional and retail investor sentiment using two established indicators. Institutional sentiment is represented by the National…

10.13.2025
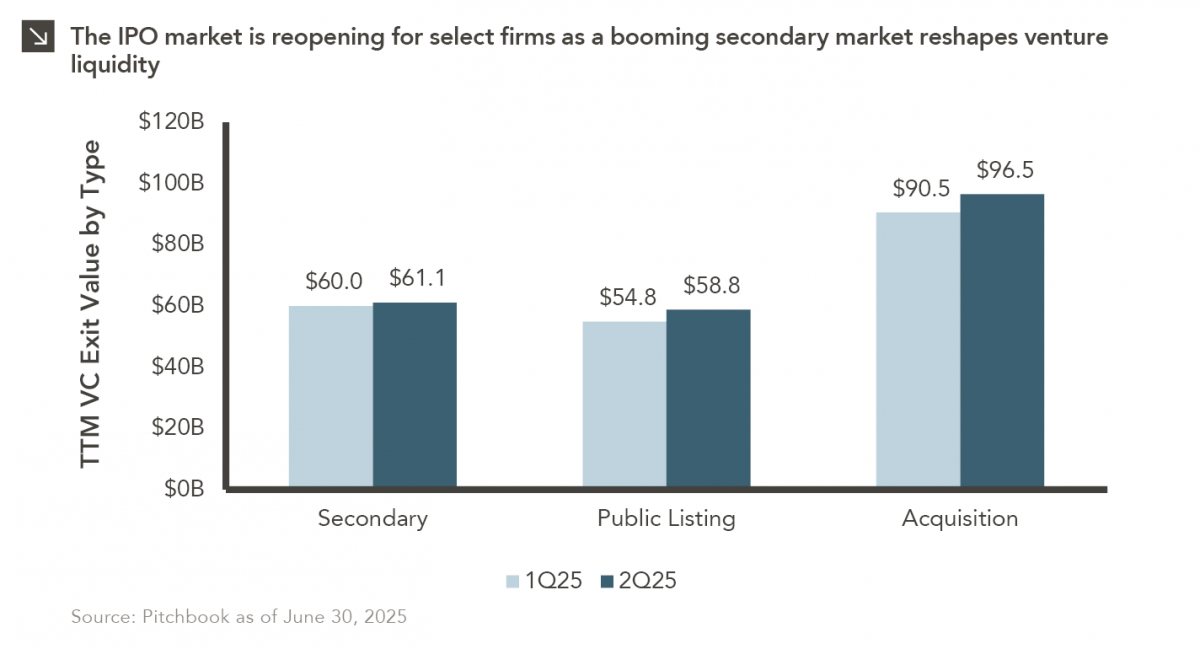
After a three-year drought, the IPO market is stirring again… but only for a select few. Just 18 companies have…

10.06.2025
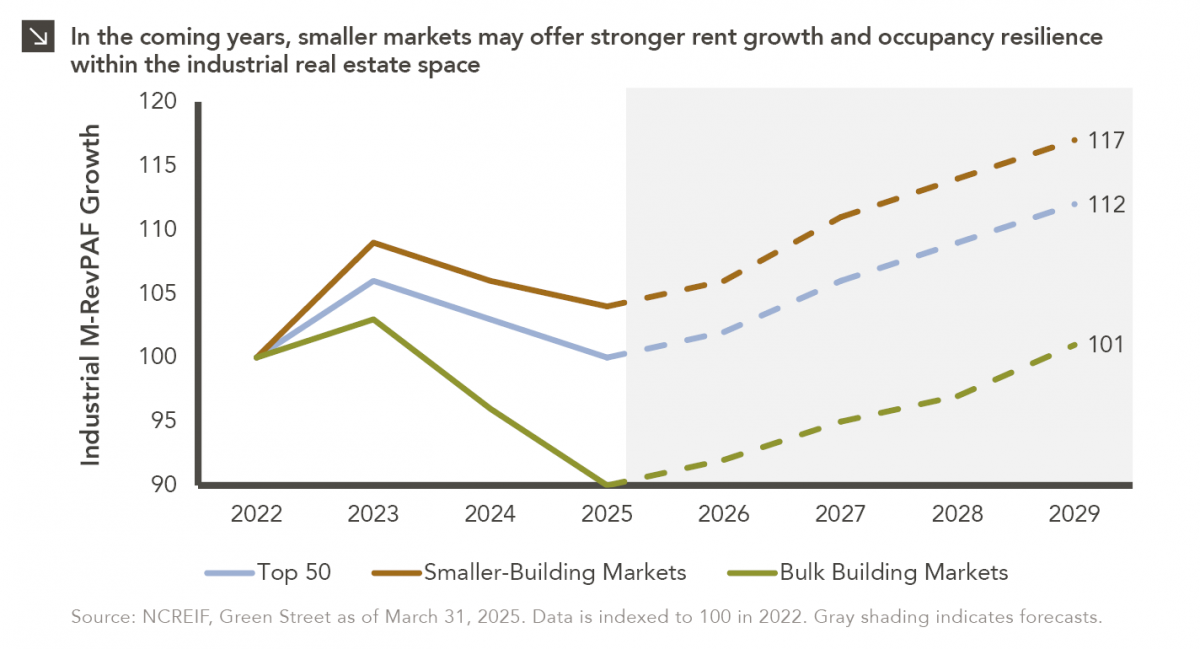
This week’s chart compares realized and expected Market Revenue per Available Foot (“M-RevPAF”) growth within the industrial real estate space…
Research alerts keep you updated on our latest research publications. Simply enter your contact information, choose the research alerts you would like to receive and click Subscribe. Alerts will be sent as research is published.
We respect your privacy. We will never share or sell your information.
If you have questions or need further information, please contact us directly and we will respond to your inquiry within 24 hours.
Contact Us >