Nat Kellogg, CFA
President


With the Tax Cut and Jobs Act (“TCJA”) now a little over a year old, this week’s chart looks at the effect of the tax cut on companies in the S&P 500. Despite a headline corporate tax rate of 35%, S&P companies in aggregate were paying an effective tax of only 25% over the twelve months leading up to the tax cut. Lowering the headline rate from 35% to 21% has clearly had an effect, as the tax rate for the S&P at the end of the third quarter was down to just 18.4% (a reduction of almost 27% year-over-year). This was one of the main drivers of strong growth in profits for U.S. companies, as the S&P 500 earnings growth peaked at 27% year-over-year in the third quarter (blue dotted line in the second chart). However, as we move into 2019 the positive effects on earnings growth from the tax cuts will fade, and corporate earnings growth in 2019 is likely to be significantly slower than what investors experienced in 2018, which could be a headwind for the equity market as the year progresses.
Print PDF> Slower Earnings Growth in 2019?
The opinions expressed herein are those of Marquette Associates, Inc. (“Marquette”), and are subject to change without notice. This material is not financial advice or an offer to purchase or sell any product. Marquette reserves the right to modify its current investment strategies and techniques based on changing market dynamics or client needs.

The opinions expressed herein are those of Marquette Associates, Inc. (“Marquette”), and are subject to change without notice. This material is not financial advice or an offer to purchase or sell any product. Marquette reserves the right to modify its current investment strategies and techniques based on changing market dynamics or client needs.

07.07.2026
JULY 23 — 1:00pm CT Please join Marquette’s research team for our 2026 Halftime Market Insights Webinar…
07.06.2026
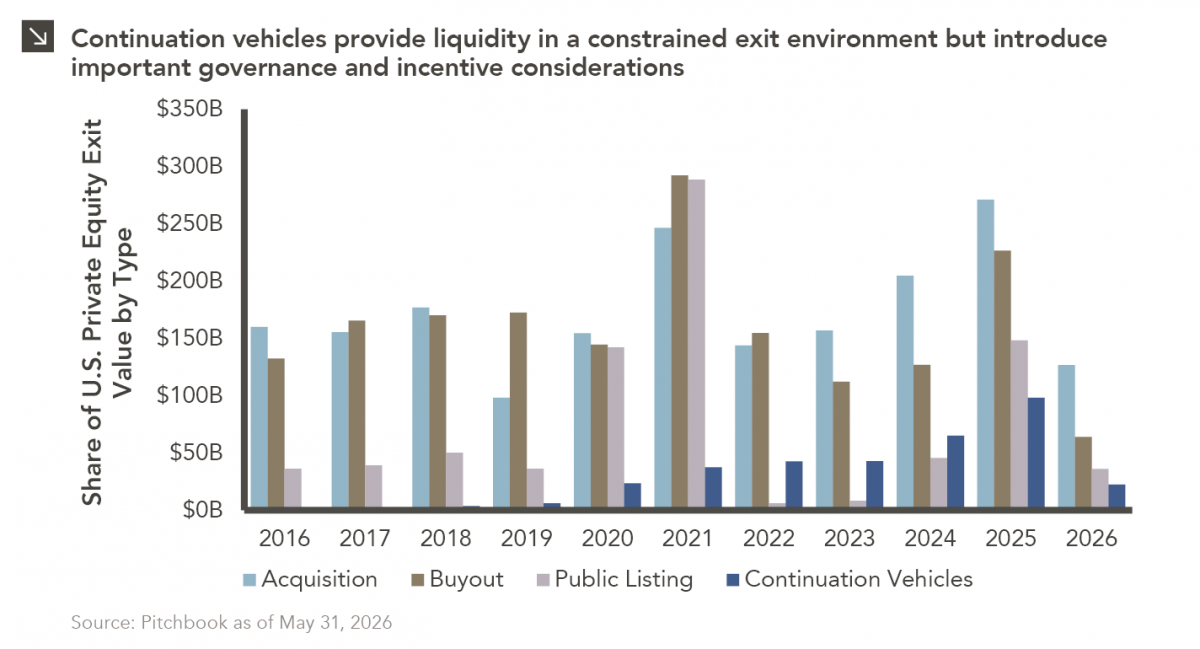
Since traditional exit routes have remained constrained in recent years due to higher interest rates, valuation gaps, and a subdued…
06.29.2026
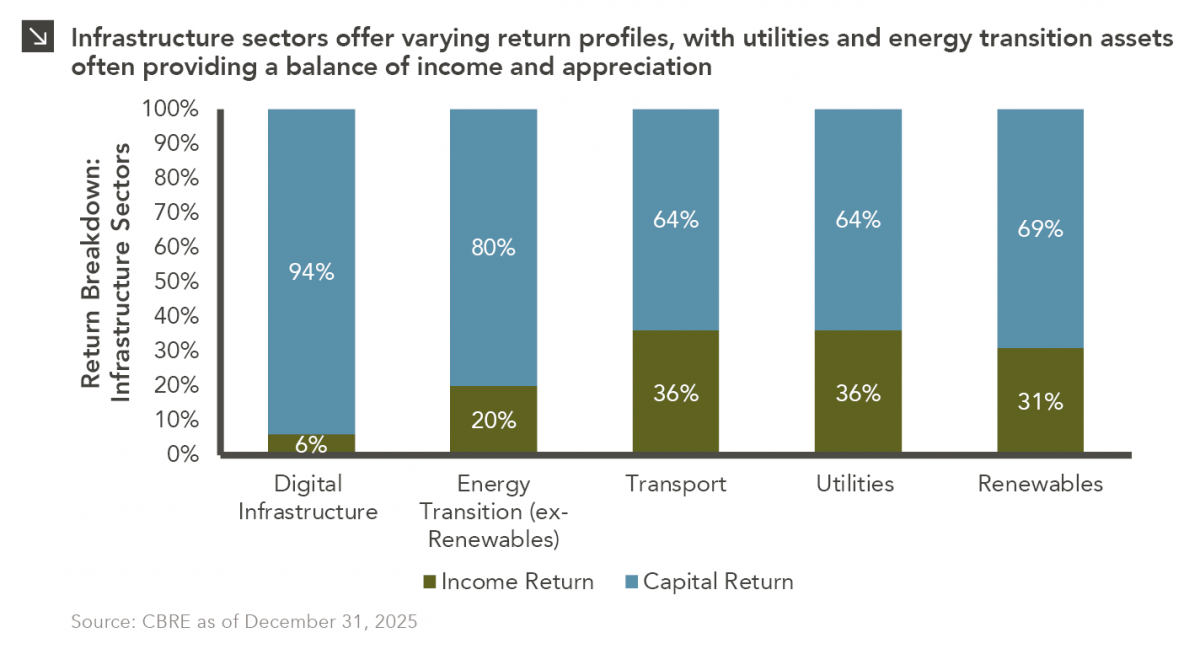
This week’s chart highlights the varying return profiles across key infrastructure sectors by illustrating the split between income and capital…

06.25.2026
Commodities represent a unique asset class within global financial markets. Like equities and bonds, commodity prices are influenced by the…
06.22.2026
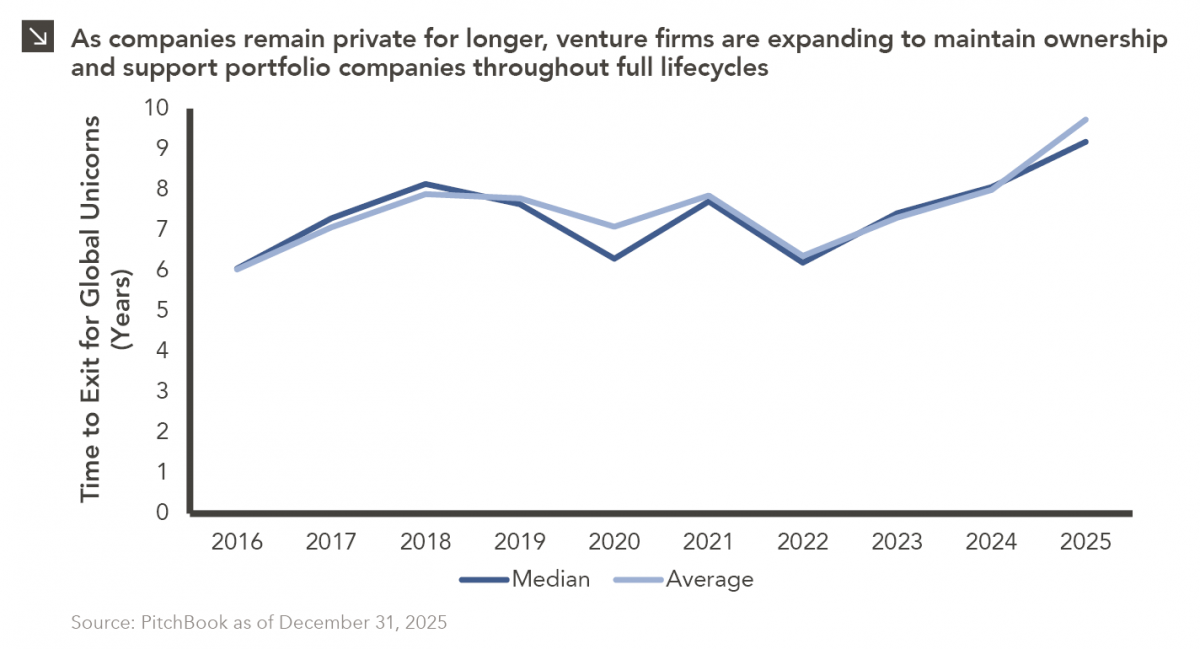
When Benchmark, one of Silicon Valley’s most renowned early-stage venture capital firms, closed $2 billion across two new funds this…
06.15.2026
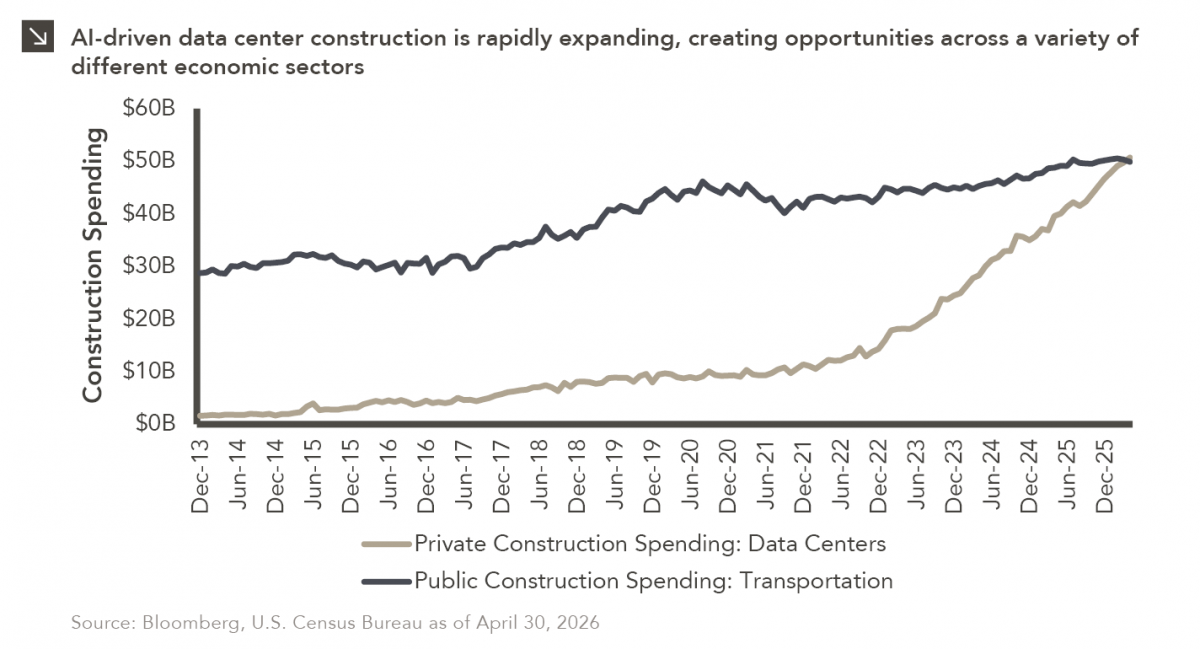
The rapid buildout of artificial intelligence infrastructure is reshaping the U.S. investment landscape. According to recent Census Bureau data, spending…
Research alerts keep you updated on our latest research publications. Simply enter your contact information, choose the research alerts you would like to receive and click Subscribe. Alerts will be sent as research is published.
We respect your privacy. We will never share or sell your information.
If you have questions or need further information, please contact us directly and we will respond to your inquiry within 24 hours.
Contact Us >