David Hernandez, CFA
Director of Traditional Manager Search


This week’s Chart of the Week examines four types of loans and their delinquency rates over the past twenty years. A loan is considered to be delinquent if it is past due by thirty or more days. The delinquency rate is the percentage of loans that are considered to be delinquent.
The chart shows all four delinquency rates are on a noticeable decline from their peaks as the economy has made some improvements over the last two years. In fact, three of the four rates have fallen below their respective twenty year averages. Business loan delinquency rates have followed the pattern of the business cycle therefore it is not surprising to see the rates go down as we emerge from recession. Consumer and credit card delinquency rate declines are due in large part to commercial banks writing off bad debt, a tightening of lending standards, and consumers deleveraging. More individuals are no longer paying their mortgages, thus freeing up money to pay off other debts.
The delinquency rate for single family mortgages remains considerably higher than its twenty year average. Many homes are now valued significantly lower than their loan balances. This fact, coupled with a challenging job market, has contributed to the high delinquency rate. The potential that these delinquent properties will eventually end up in foreclosure make it an even more challenging environment for residential real estate. Foreclosures will increase the supply in an already oversupplied market and exacerbate the downward pressure on home prices. As discussed in our 2012 Market Preview, this environment has led to a boom for owners of rental units: the apartment sector has benefitted because individuals are now turning to rentals rather than purchasing homes.

The opinions expressed herein are those of Marquette Associates, Inc. (“Marquette”), and are subject to change without notice. This material is not financial advice or an offer to purchase or sell any product. Marquette reserves the right to modify its current investment strategies and techniques based on changing market dynamics or client needs.
11.09.2026
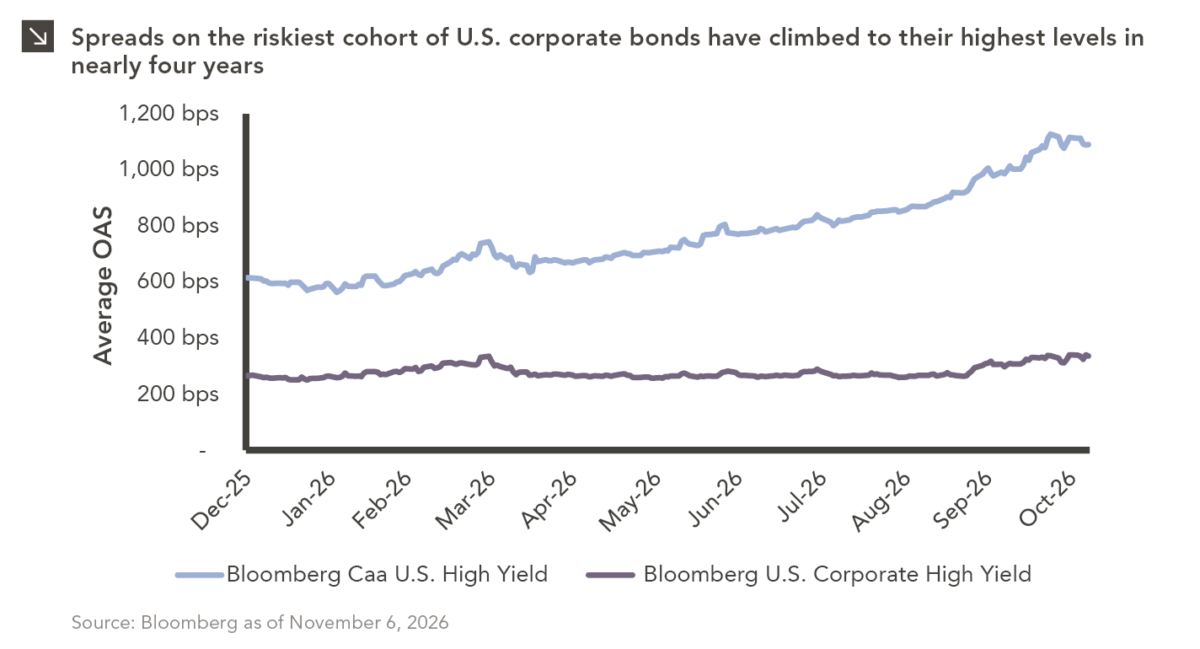
The U.S. distressed debt market is showing increasingly pronounced signs of stress. As of this writing, option-adjusted spreads on CCC-rated…
11.02.2026
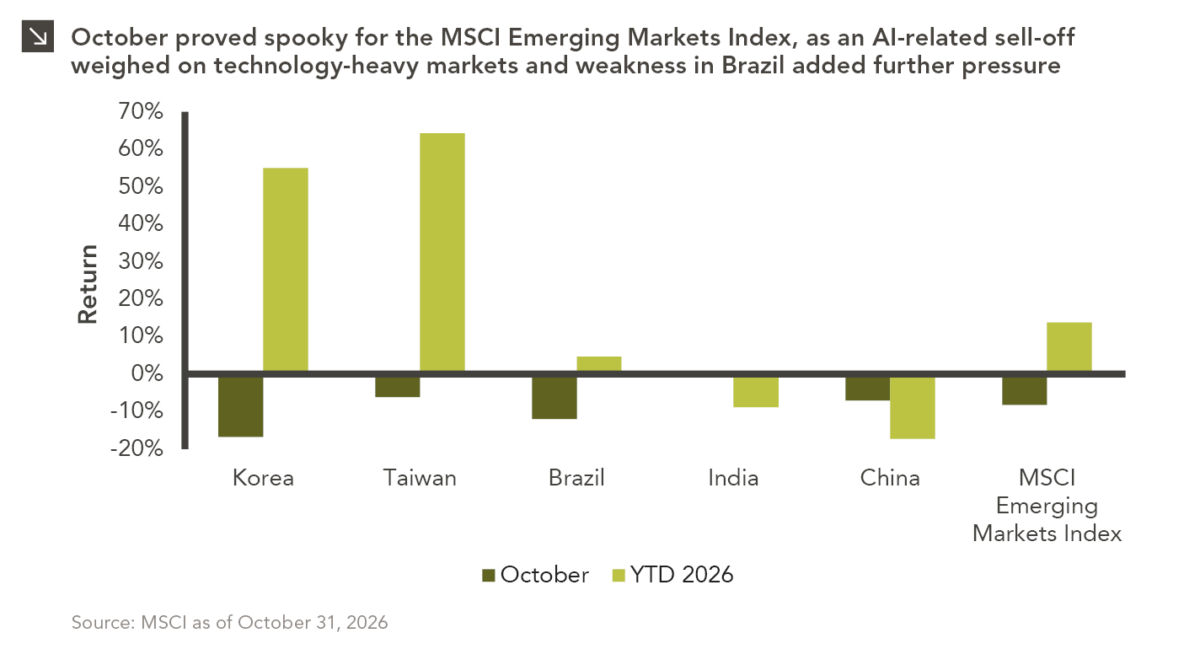
Emerging markets faced a challenging October, with the space declining by around 8.3% amid renewed concerns over the sustainability of…
10.26.2026
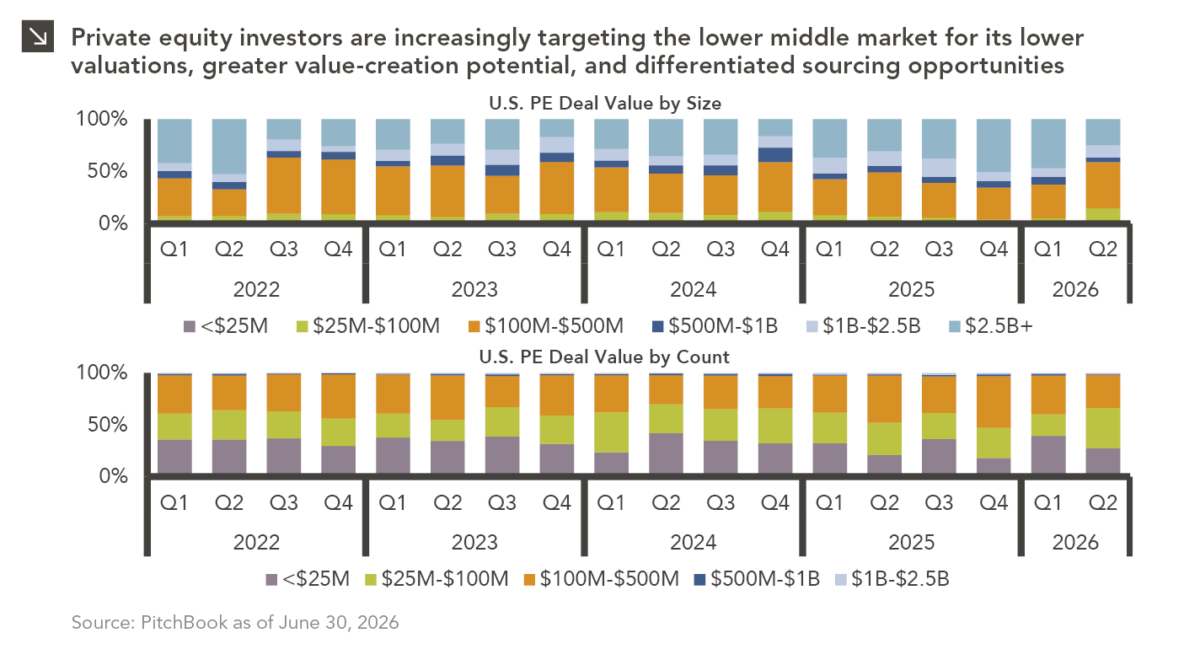
Private equity activity is increasingly shifting toward smaller transactions, with total deal value for transactions of $100 million or less…

10.08.2026
This video is a recording of a live webinar held October 22 by Marquette’s research team analyzing the third quarter…

10.22.2026
Anyone who has run a marathon knows the last six miles are brutal — no matter how well the first…
10.19.2026
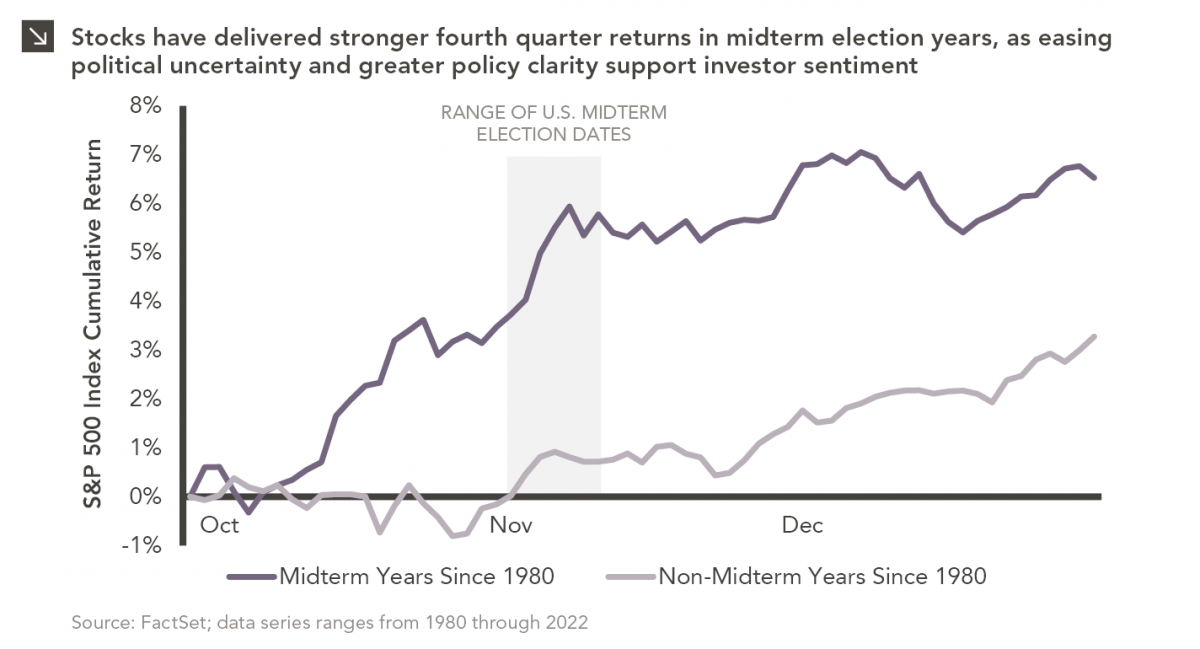
Since 1980, the S&P 500 Index has generally performed well in the weeks surrounding U.S. midterm elections. Specifically, the index…
Research alerts keep you updated on our latest research publications. Simply enter your contact information, choose the research alerts you would like to receive and click Subscribe. Alerts will be sent as research is published.
We respect your privacy. We will never share or sell your information.
If you have questions or need further information, please contact us directly and we will respond to your inquiry within 24 hours.
Contact Us >