Tom Salemy, CFA, CAIA
Partner


This week’s chart shows trends in tax revenues, indexed to 2007, for a group of ten selected countries (based on rolling twelve month averages for each). Taxes are the main source of government revenues and a crucial factor for the fiscal stability and economic growth of countries. Tax revenues are appropriated for public works, interest payments, financial assistance, education, infrastructure, growth incentives, and counter cyclical measures.
As the chart illustrates, there has been a divergence of tax revenues between developed and emerging market countries. Since 2007, most emerging market governments’ tax revenues have increased while the majority of developed countries’ tax revenues have either decreased or slightly increased.1 Many developed countries across the world continue to face revenue headwinds as they de-lever and recover from the 2008 financial crisis and subsequent economic slow-down, all of which have lowered tax revenues.
Going forward, this chart suggests a much more favorable backdrop for emerging market countries compared to developed countries. An increasing trend in tax revenues should allow emerging market countries to allocate money to public services as well as investment in infrastructure, education, research and development, and other important factors that contribute to countries’ long-term success and prosperity. Developed countries are struggling to maintain public services and programs with limited revenues and are being forced to borrow money; the U.S. has over $15 trillion in debt outstanding and is projected to run a deficit of approximately $1.2 trillion in 2012.2 As this occurs, investment in infrastructure, education, and other important growth platforms is placed on hold as more money is allocated towards debt and interest payments.
___________________________________________________________________________________
1 Bank of Korea, Bank of Italy, Federal Reserve, Bank of Thailand, UK Office for National Statistics, Bank of Greece, National Bank of Poland, Bank of Japan, Bank of Spain, Bank of the Republic of Columbia
2 Congressional Budget Office as of 03/31/2012

The opinions expressed herein are those of Marquette Associates, Inc. (“Marquette”), and are subject to change without notice. This material is not financial advice or an offer to purchase or sell any product. Marquette reserves the right to modify its current investment strategies and techniques based on changing market dynamics or client needs.

07.07.2026
JULY 23 — 1:00pm CT Please join Marquette’s research team for our 2026 Halftime Market Insights Webinar…
07.06.2026
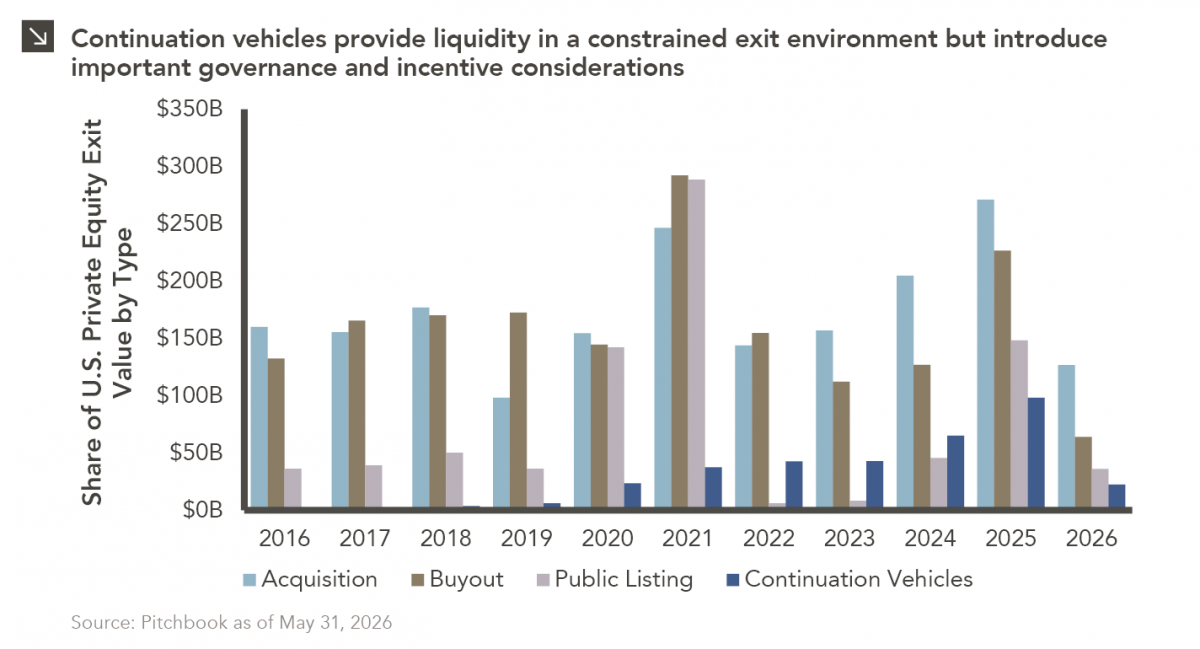
Since traditional exit routes have remained constrained in recent years due to higher interest rates, valuation gaps, and a subdued…
06.29.2026
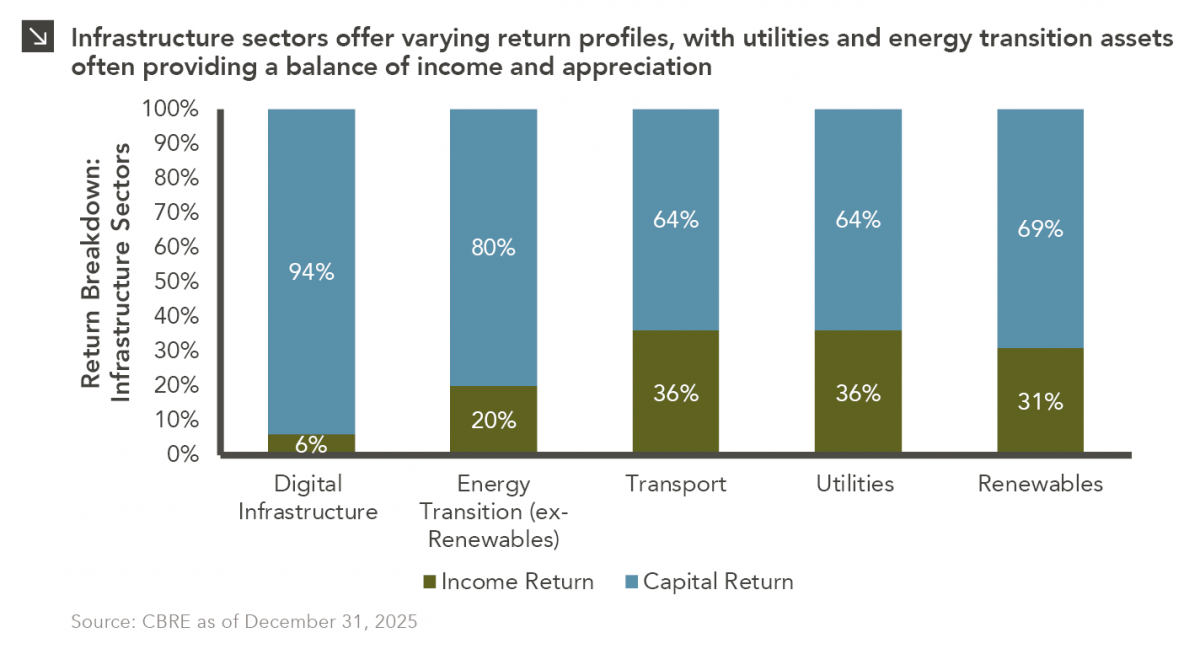
This week’s chart highlights the varying return profiles across key infrastructure sectors by illustrating the split between income and capital…

06.25.2026
Commodities represent a unique asset class within global financial markets. Like equities and bonds, commodity prices are influenced by the…
06.22.2026
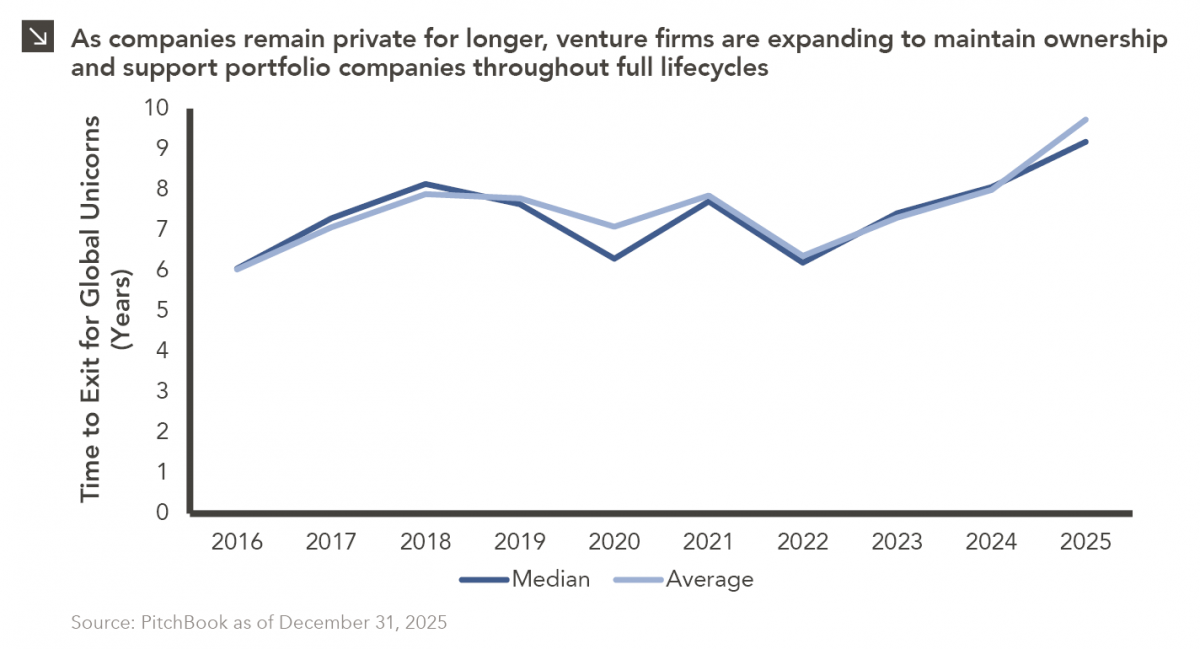
When Benchmark, one of Silicon Valley’s most renowned early-stage venture capital firms, closed $2 billion across two new funds this…
06.15.2026
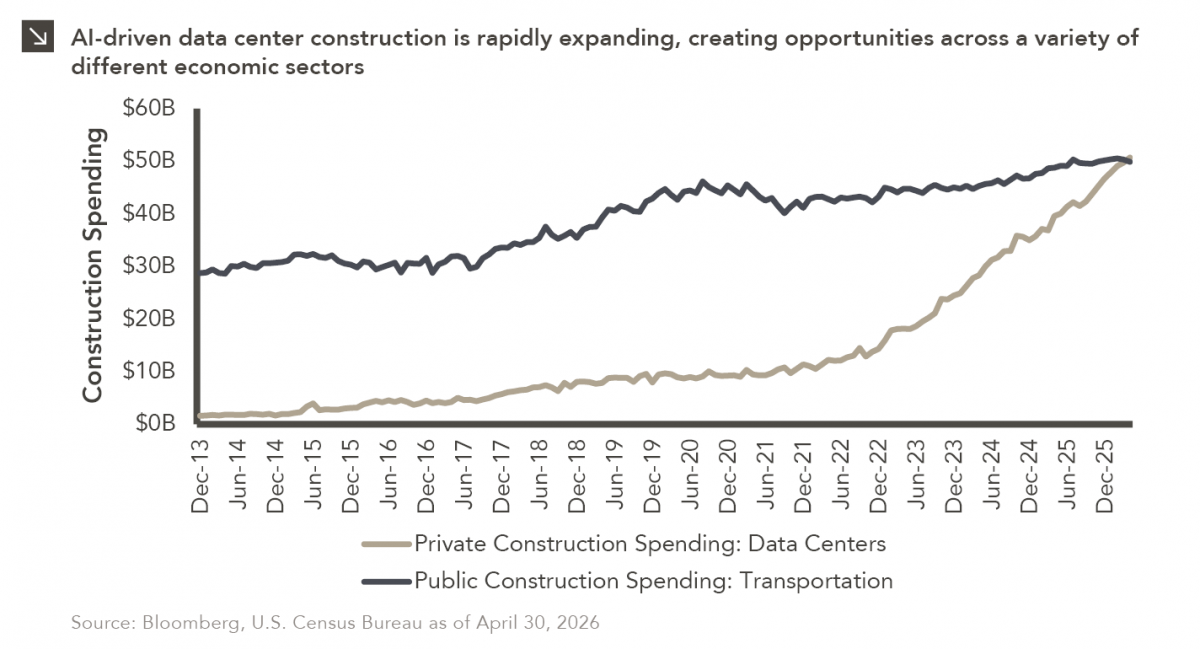
The rapid buildout of artificial intelligence infrastructure is reshaping the U.S. investment landscape. According to recent Census Bureau data, spending…
Research alerts keep you updated on our latest research publications. Simply enter your contact information, choose the research alerts you would like to receive and click Subscribe. Alerts will be sent as research is published.
We respect your privacy. We will never share or sell your information.
If you have questions or need further information, please contact us directly and we will respond to your inquiry within 24 hours.
Contact Us >