Doug Oest, CAIA
Partner


With election campaigning in full swing, we have received a number of questions from our clients regarding what will happen to the market if a particular candidate or party wins, or whether certain years of the presidential cycle are better for investors. This week’s chart of the week examines past studies on election years and market returns, as well as other market patterns.
Thus far in 2012, there have been numerous articles focused on finding the relationship between the market cycle and the election cycle. Notable findings of these articles are highlighted below:
Heading into the 2008 election year, various articles highlighted similar election year market performance, which at that time had a median return of nearly 14%. Of course, 2008 turned out to be one of the worst years for the stock market. This performance was not due to the election year, but rather a massive collapse in the housing market, the credit crisis, and one of the deepest recessions the United States has experienced.
While certain patterns may exist in the return data, the data set is extremely limited; it most likely is a case of identifying random patterns in limited data set. For instance, an investor who only invested in the stock market during odd years would do significantly better than investing in all years, or an investor who only invested in even years. Similar extrapolations can be made based on years ending with a certain digit (3, 5, etc).
In order to be statistically significant, one would need over 2,000 election year data points in order to achieve a 0.05 significance level. Similar levels of observations would be needed for the other data points highlighted in the table. While there may or may not be particular reasons behind these realized returns phenomenon, from a statistical standpoint it would be unwise to base any investment decisions off of them.

The opinions expressed herein are those of Marquette Associates, Inc. (“Marquette”), and are subject to change without notice. This material is not financial advice or an offer to purchase or sell any product. Marquette reserves the right to modify its current investment strategies and techniques based on changing market dynamics or client needs.

07.07.2026
JULY 23 — 1:00pm CT Please join Marquette’s research team for our 2026 Halftime Market Insights Webinar…
07.06.2026
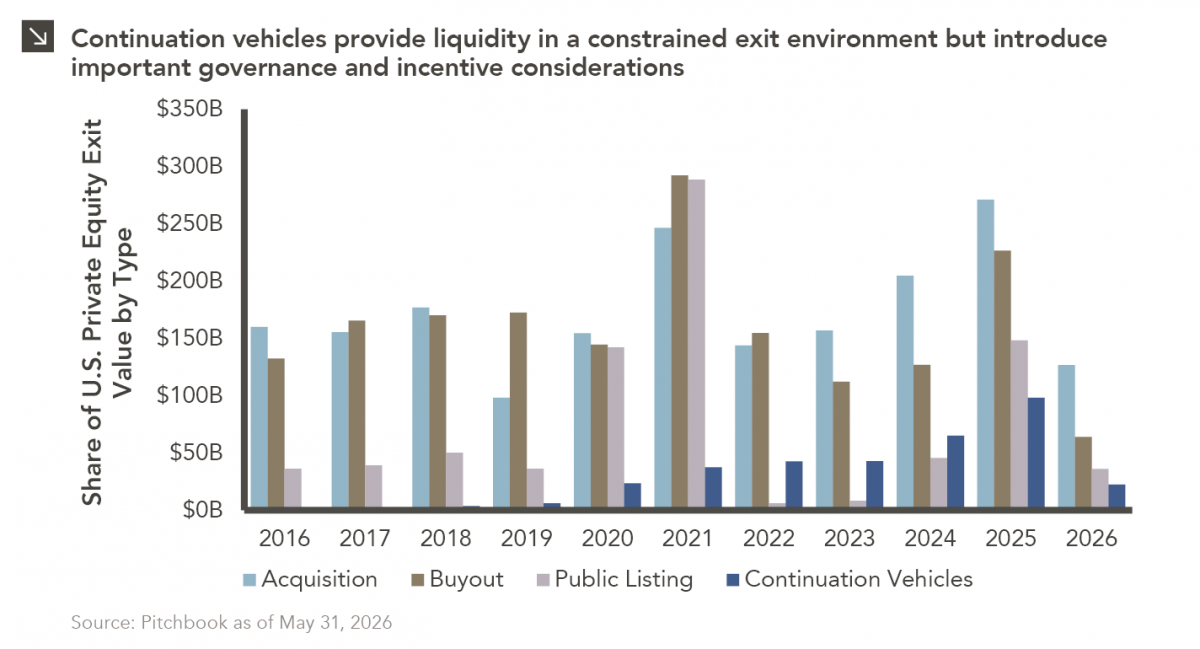
Since traditional exit routes have remained constrained in recent years due to higher interest rates, valuation gaps, and a subdued…
06.29.2026
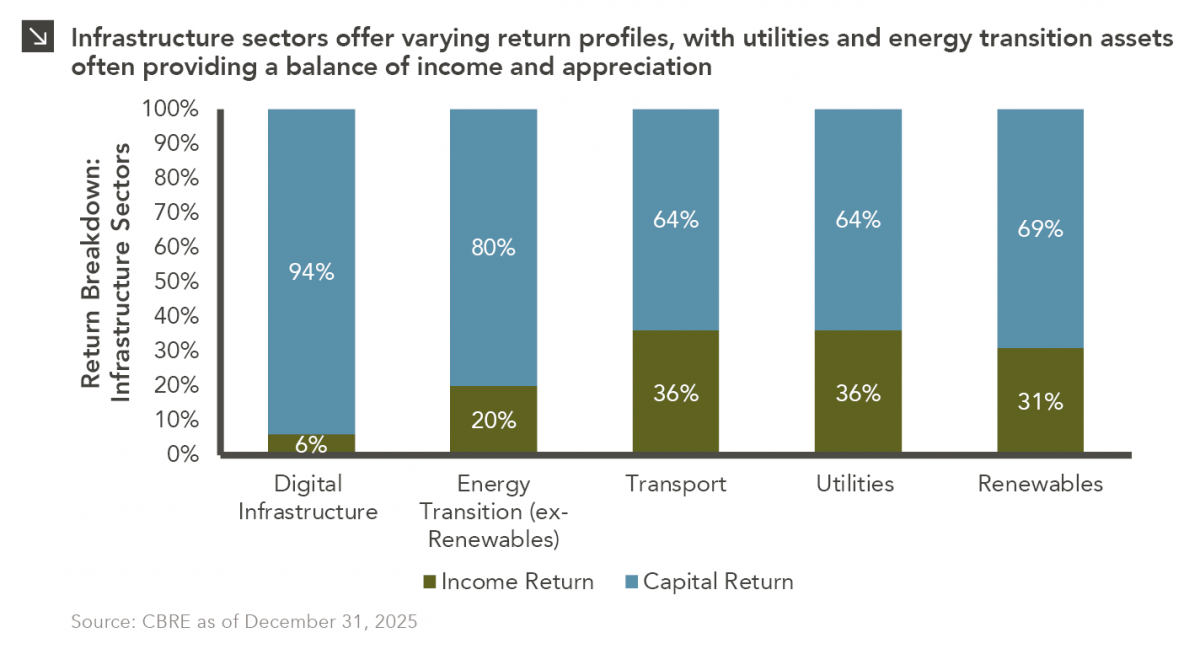
This week’s chart highlights the varying return profiles across key infrastructure sectors by illustrating the split between income and capital…
06.22.2026
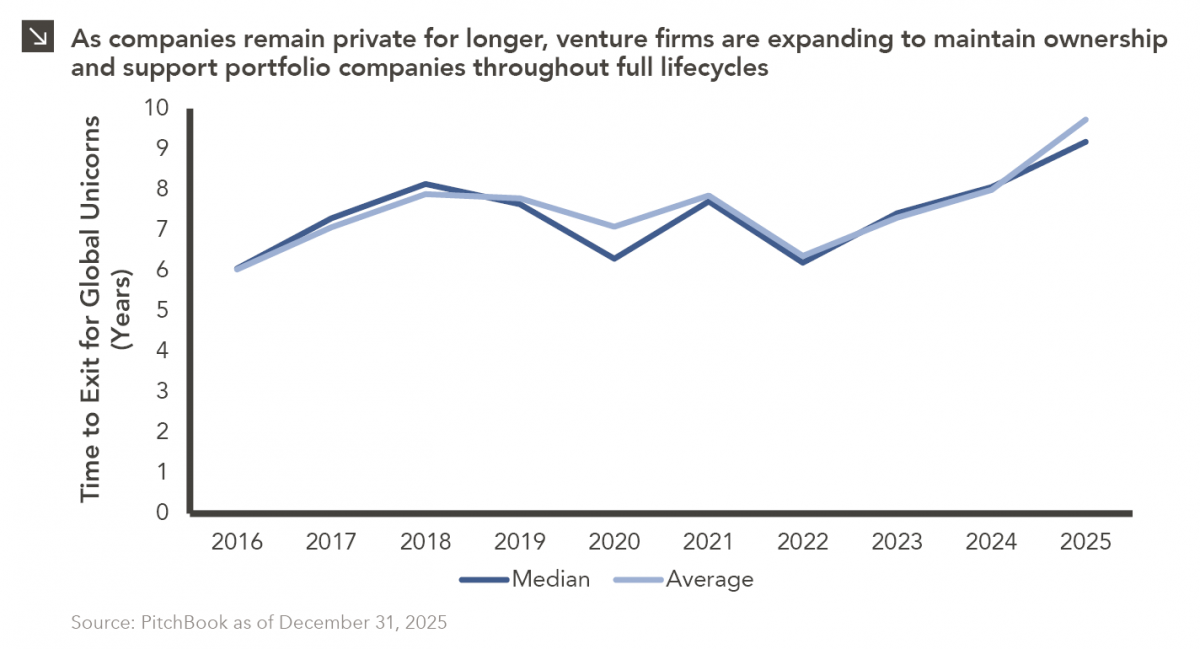
When Benchmark, one of Silicon Valley’s most renowned early-stage venture capital firms, closed $2 billion across two new funds this…
06.15.2026
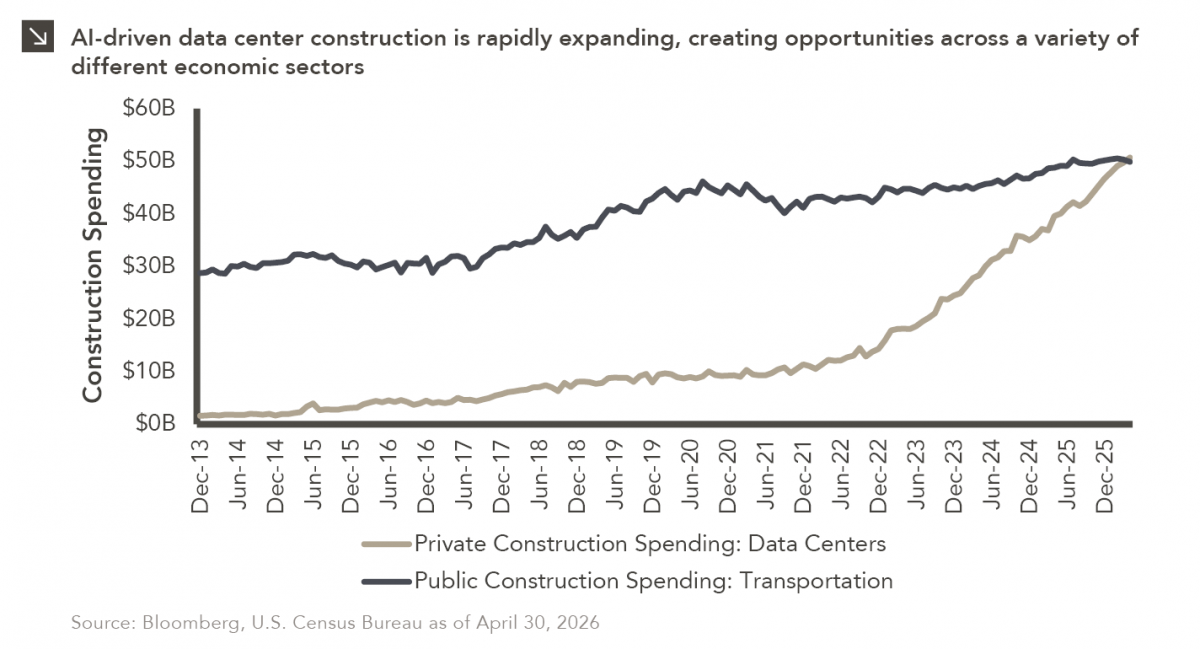
The rapid buildout of artificial intelligence infrastructure is reshaping the U.S. investment landscape. According to recent Census Bureau data, spending…
06.08.2026
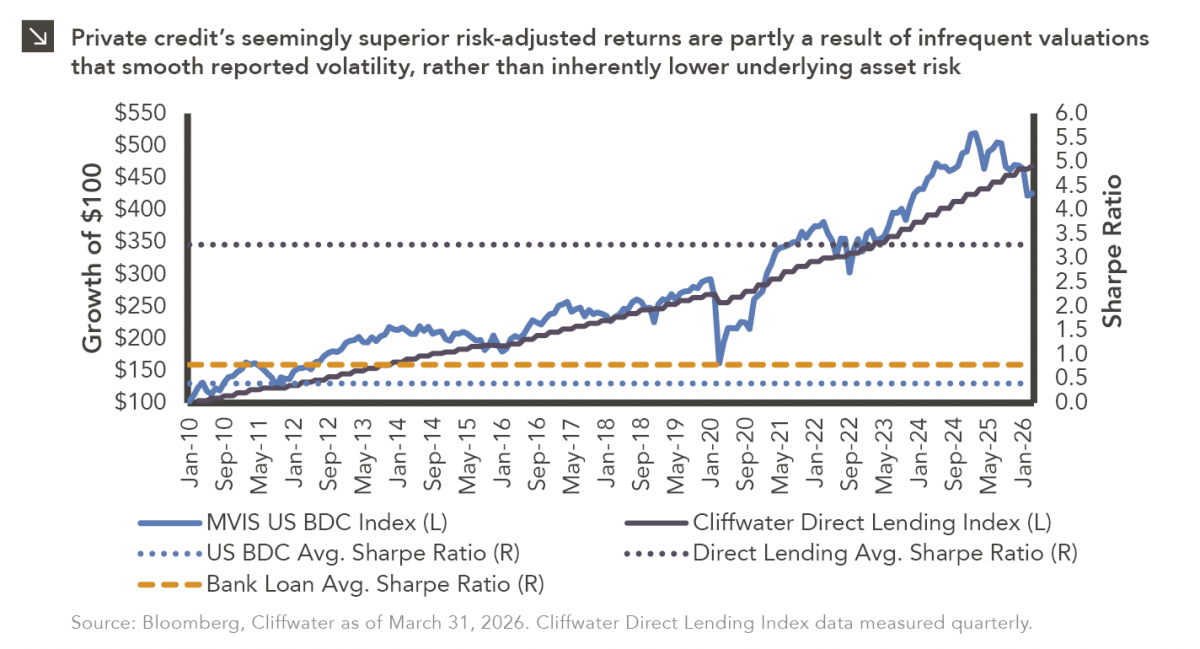
Hi, James Torgerson here! Volatility can be an unsightly blemish on portfolios and lead to inferior risk-adjusted returns. Private credit…
Research alerts keep you updated on our latest research publications. Simply enter your contact information, choose the research alerts you would like to receive and click Subscribe. Alerts will be sent as research is published.
We respect your privacy. We will never share or sell your information.
If you have questions or need further information, please contact us directly and we will respond to your inquiry within 24 hours.
Contact Us >