11.09.2026
C’s Get Degrees (of Pain)
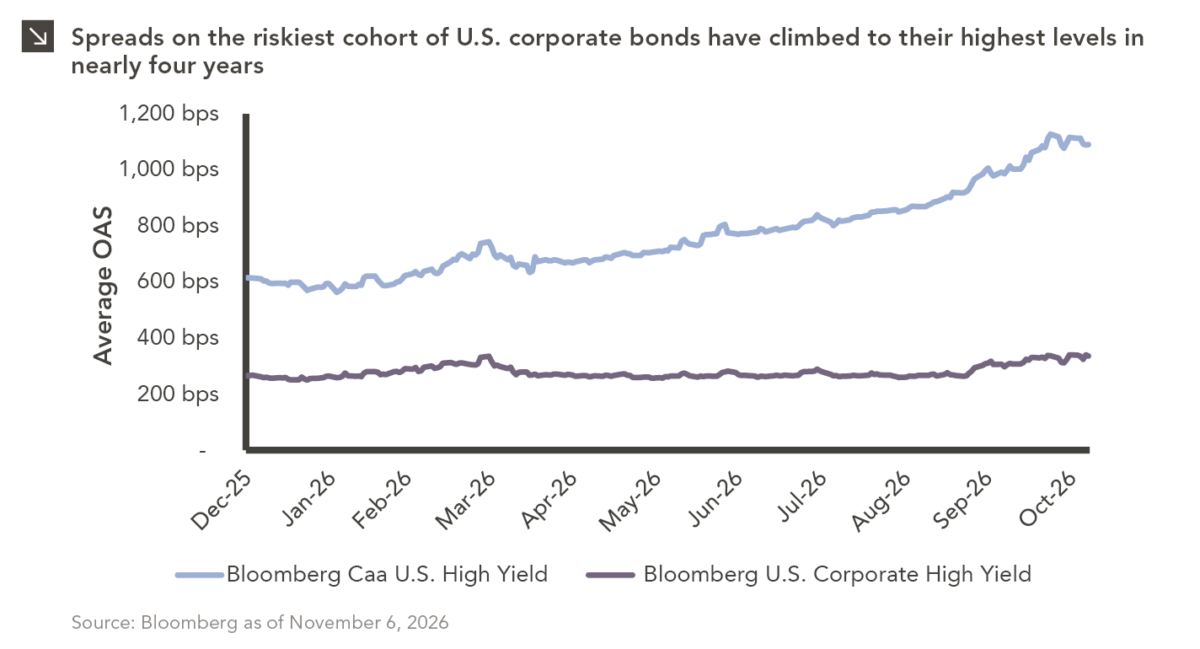
The U.S. distressed debt market is showing increasingly pronounced signs of stress. As of this writing, option-adjusted spreads on CCC-rated…


This video coincides with our annual Market Preview newsletters and includes a recap of 2019’s performance and what investors can expect heading into 2020. 2019 was certainly a profitable year for investors as traditional and alternative asset classes delivered positive returns. As we enter 2020, there are a litany of questions facing global markets ranging from the U.S. election to trade disputes to global monetary policy, all of which will undoubtedly influence investment returns.
This video is part of our Market Insights series, a quarterly presentation designed to brief clients on the market as soon as possible after quarterly market data becomes available. Members of our research team discuss the overall U.S. economy, along with fixed income, U.S. and non-U.S. equity, hedge funds, private equity, real estate, and infrastructure.
For more information, questions, or feedback, please send us an email.
The opinions expressed herein are those of Marquette Associates, Inc. (“Marquette”), and are subject to change without notice. This material is not financial advice or an offer to purchase or sell any product. Marquette reserves the right to modify its current investment strategies and techniques based on changing market dynamics or client needs. Marquette is an independent investment adviser registered under the Investment Advisers Act of 1940, as amended. Registration does not imply a certain level of skill or training. More information about Marquette including our investment strategies, fees and objectives can be found in our ADV Part 2, which is available upon request.
11.09.2026
The U.S. distressed debt market is showing increasingly pronounced signs of stress. As of this writing, option-adjusted spreads on CCC-rated…
11.02.2026
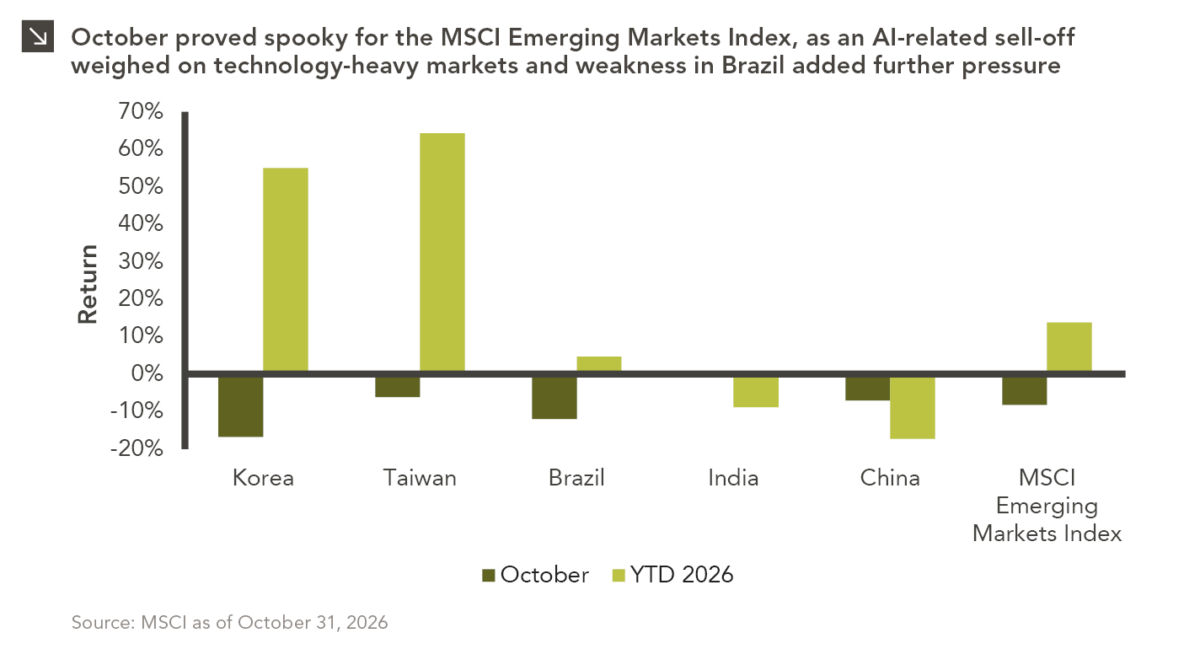
Emerging markets faced a challenging October, with the space declining by around 8.3% amid renewed concerns over the sustainability of…
10.26.2026
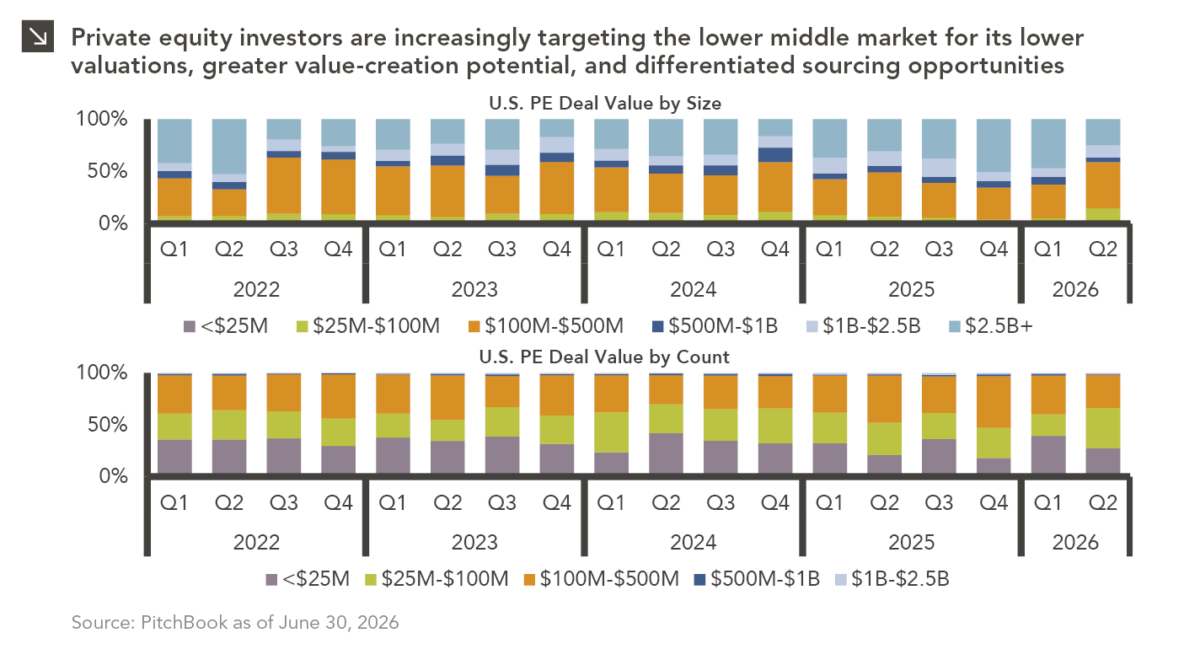
Private equity activity is increasingly shifting toward smaller transactions, with total deal value for transactions of $100 million or less…

10.08.2026
This video is a recording of a live webinar held October 22 by Marquette’s research team analyzing the third quarter…

10.22.2026
Anyone who has run a marathon knows the last six miles are brutal — no matter how well the first…
10.19.2026
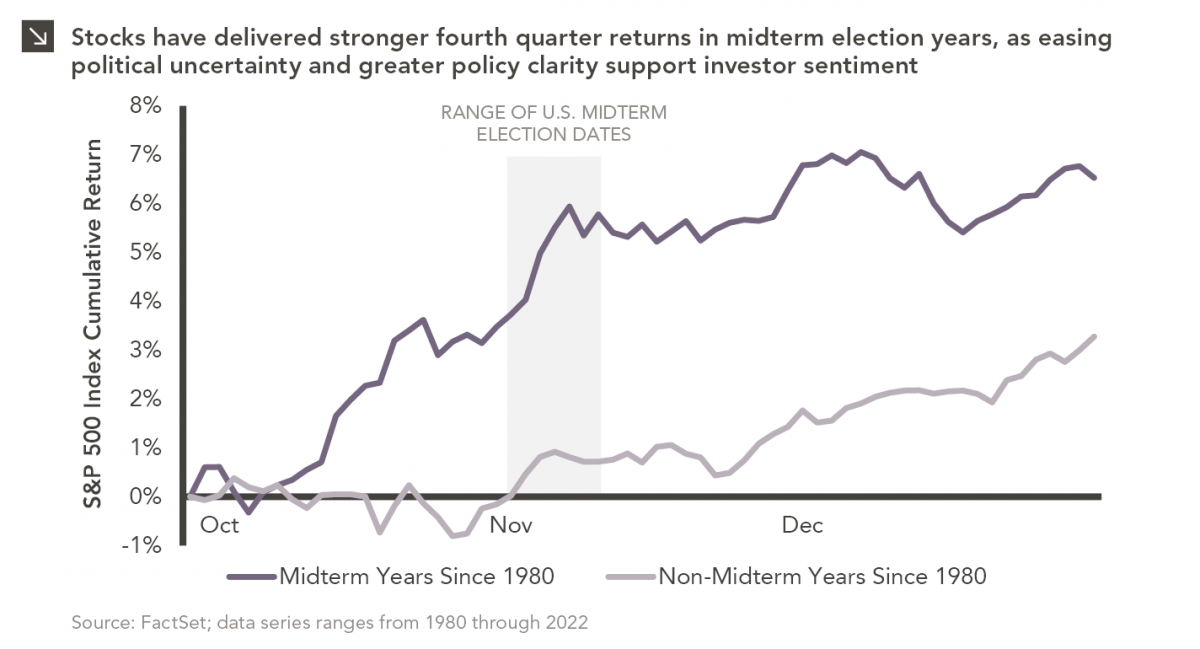
Since 1980, the S&P 500 Index has generally performed well in the weeks surrounding U.S. midterm elections. Specifically, the index…
Research alerts keep you updated on our latest research publications. Simply enter your contact information, choose the research alerts you would like to receive and click Subscribe. Alerts will be sent as research is published.
We respect your privacy. We will never share or sell your information.
If you have questions or need further information, please contact us directly and we will respond to your inquiry within 24 hours.
Contact Us >