06.15.2026
Centers of Attention
The rapid buildout of artificial intelligence infrastructure is reshaping the U.S. investment landscape. According to recent Census Bureau data, spending…
After reaching a high of 3,386 on February 19th, the longest bull market in history officially made a record fall into bear market territory in the span of just 16 trading days and only a few days after its 11th anniversary. The S&P 500 has now been in a bear market, defined as a decline of 20% or more, for nearly a week. So when should we expect the market to hit bottom? And when will this decline end?
This newsletter uses historical data to provide guidance and explanation of bear markets and their subsequent recoveries, including a detailed look at S&P 500 performance, small-cap performance, volatility, and valuations. While no one knows the specifics of how the future will play out, the data we’ve compiled offers perspective on what the typical bear market correction is, how far we are from that level, worst case scenarios, and possible opportunities to buy equities at attractive prices.
Read > An Analysis of Bear Markets and Recoveries
The opinions expressed herein are those of Marquette Associates, Inc. (“Marquette”), and are subject to change without notice. This material is not financial advice or an offer to purchase or sell any product. Marquette reserves the right to modify its current investment strategies and techniques based on changing market dynamics or client needs.

06.15.2026
The rapid buildout of artificial intelligence infrastructure is reshaping the U.S. investment landscape. According to recent Census Bureau data, spending…

05.26.2026
The classic novel A Tale of Two Cities by Charles Dickens begins with the line “It was the best of…

05.18.2026
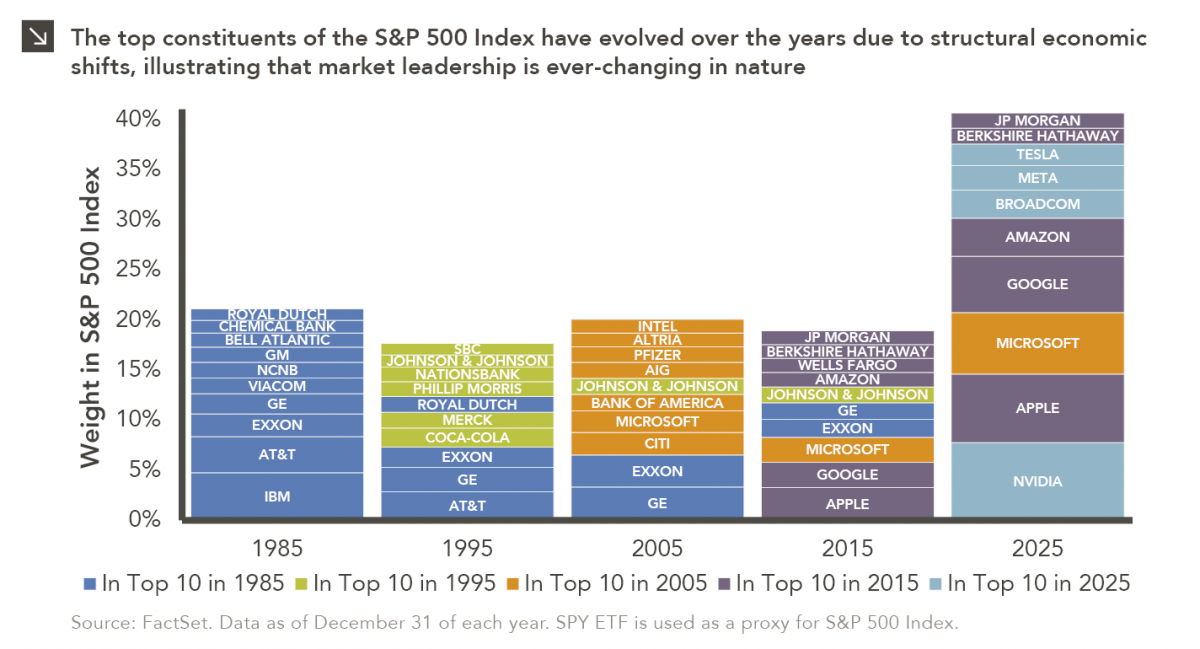
Over the last few years, equity markets have been defined by a group of stocks often referred to as the…

05.11.2026
In addition to the humanitarian toll of the conflict in Iran, the world is currently confronting the impact that trade…
05.07.2026
The leadership structure of the Federal Reserve is intentionally designed to promote continuity, independence, and institutional stability across political cycles….
05.04.2026
Rooted in medieval Persian Sufi thought, the adage “this too shall pass” speaks to the fleeting and impermanent nature of…
Research alerts keep you updated on our latest research publications. Simply enter your contact information, choose the research alerts you would like to receive and click Subscribe. Alerts will be sent as research is published.
We respect your privacy. We will never share or sell your information.
If you have questions or need further information, please contact us directly and we will respond to your inquiry within 24 hours.
Contact Us >