10.19.2026
Divided We Rise?
Since 1980, the S&P 500 Index has generally performed well in the weeks surrounding U.S. midterm elections. Specifically, the index…


This week’s chart looks at the recent fund flows and the trailing twelve-month (“TTM”) percentage growth rate of liquid alternatives as of March 31, 2014. Over the past decade, private investment managers, traditionally associated with less liquid investments such as hedge funds, private equity, and real estate, have expanded their investment focus towards the creation of liquid alternative products that comply with the 1940 Investment Company Act in order to meet the demands of the rapidly growing defined contribution market.
Within the open-ended mutual fund universe, liquid alternatives have once again topped all other asset classes with the highest organic growth rate over the TTM period, up 39.5% as of March 31, 2014. Although this growth rate is impressive, liquid alternative assets only represent 1.3% ($149B) of the U.S. mutual fund universe, which has over $11 trillion in assets.
As the trend toward liquid alternatives continues to grow, investors should consider the potential implications and effectiveness of the newly designed strategies. ’40 Act funds must comply with restrictions not required by traditional hedge funds such as leverage limits, short-selling, and liquidity. In addition, the standard 1.5% and 20% hedge fund fee structure has to be adjusted within the ’40 Act universe; currently, the average management fee for liquid alternative funds is around 1.5%. Since the significant rise in the formation of liquid alternative products has taken off within the past few years, investors should be cautious before diving into the space as the next decade will be a testing ground for these strategies as to whether or not they deliver on their performance expectations, in terms of both return and diversification.
The opinions expressed herein are those of Marquette Associates, Inc. (“Marquette”), and are subject to change without notice. This material is not financial advice or an offer to purchase or sell any product. Marquette reserves the right to modify its current investment strategies and techniques based on changing market dynamics or client needs.

10.19.2026
Since 1980, the S&P 500 Index has generally performed well in the weeks surrounding U.S. midterm elections. Specifically, the index…

10.12.2026
This week’s chart highlights the accelerating growth of electricity demand in the U.S., which has been driven primarily by the…

10.08.2026
LIVE WEBINAR — OCTOBER 22 Please join Marquette’s research team for our 3Q 2026 Market Insights Webinar…

10.05.2026
For investors, the spookiest thing about October might not be the ghosts and monsters that are bound to show up…

09.28.2026
The phrase “expectations of higher inflation” has become a staple in financial news to explain the increase in nominal U.S….
09.21.2026
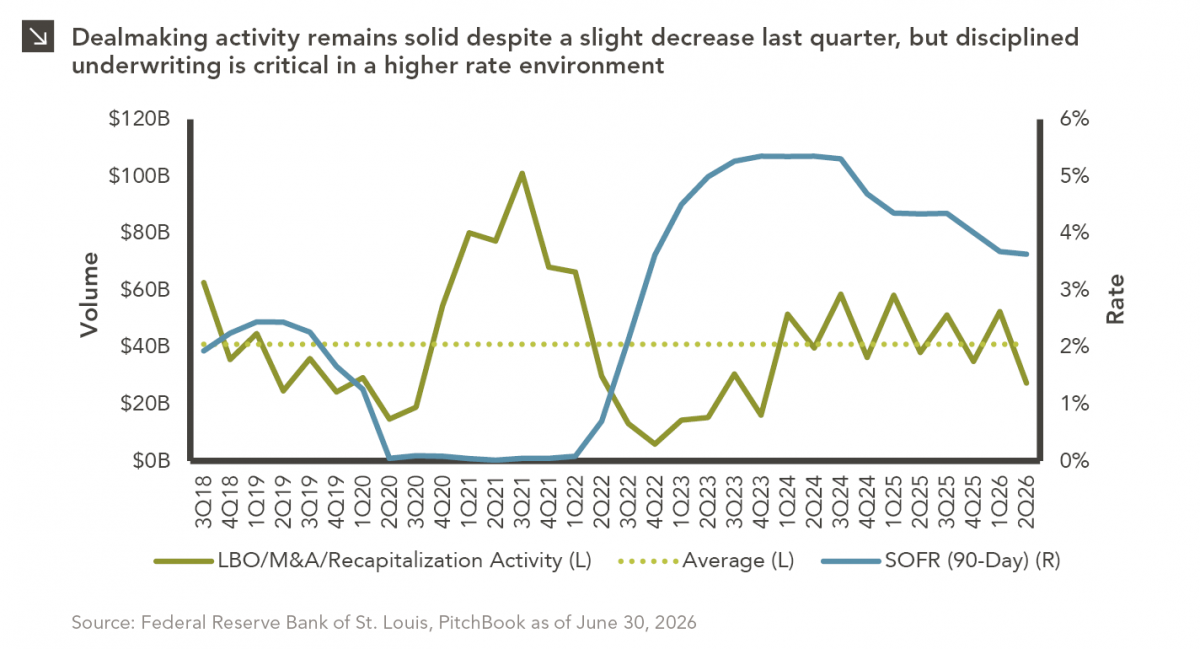
For much of the past several years, the conventional view has been that higher interest rates and stretched valuations would…
Research alerts keep you updated on our latest research publications. Simply enter your contact information, choose the research alerts you would like to receive and click Subscribe. Alerts will be sent as research is published.
We respect your privacy. We will never share or sell your information.
If you have questions or need further information, please contact us directly and we will respond to your inquiry within 24 hours.
Contact Us >