10.22.2026
Will Higher Rates Cramp the Markets?
Anyone who has run a marathon knows the last six miles are brutal — no matter how well the first…


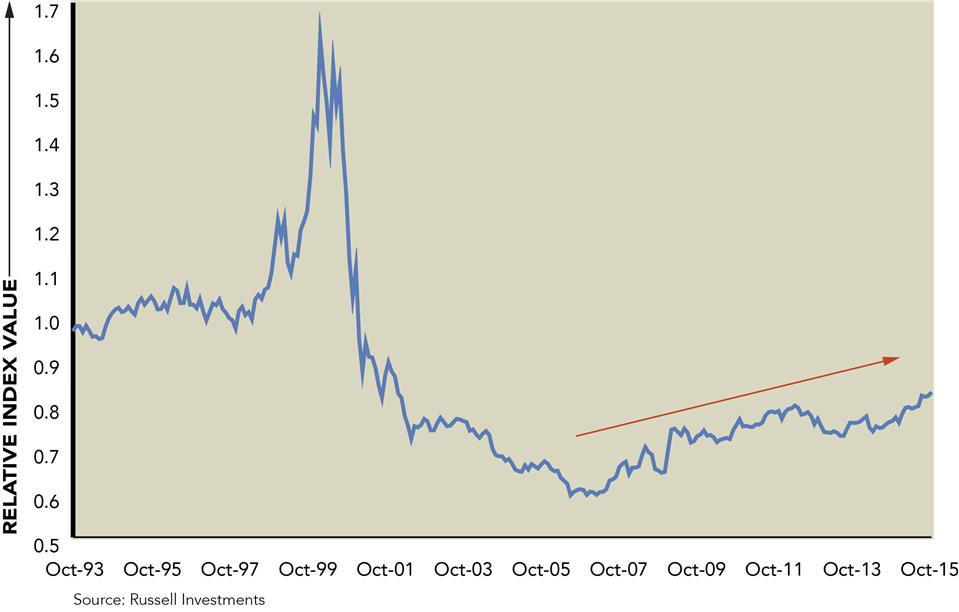
This week’s Chart of the Week examines the relative performance of growth versus value. The above chart shows the price level of the Russell 3000 Growth index relative to the Russell 3000 Value index. Growth is outperforming value when the line is in an uptrend and value is outperforming growth when the line is trending downward.
Investors may have noticed the recent outperformance of growth versus value year-to-date across small-, mid-, and large-cap. When viewed over a longer time horizon though, growth has outperformed value for almost ten years. The outperformance of growth prior to the tech bubble was much greater in magnitude; however, the current multi-year period of growth outperformance is the longest since the early 1980s.
One explanation for the current leadership of growth over value may simply be how these indices are constructed. Value indices feature a much larger allocation to the Financial and Energy sectors (representing approximately 43% of the Russell 3000 Value index as of 9/30/2015). When examining performance since the October 2007 market peak, Financials and Energy have lagged other sectors, posting cumulative returns of -20.8% and +3.1%, respectively. Areas such as Technology, Health Care, and Consumer Discretionary are among the best performing sectors since the October 2007 market peak and carry higher weightings within growth indices.
Over the long term, there will be periods when value is in favor and periods when growth is in favor. The duration of the current growth cycle calls into question how much longer growth’s outperformance will persist. Ultimately, it is extremely difficult to predict when the relative performance will shift, and yet another reminder that it is imperative to be diversified across the various size and style boxes of the U.S. equity market.
The opinions expressed herein are those of Marquette Associates, Inc. (“Marquette”), and are subject to change without notice. This material is not financial advice or an offer to purchase or sell any product. Marquette reserves the right to modify its current investment strategies and techniques based on changing market dynamics or client needs.

10.22.2026
Anyone who has run a marathon knows the last six miles are brutal — no matter how well the first…

10.19.2026
Since 1980, the S&P 500 Index has generally performed well in the weeks surrounding U.S. midterm elections. Specifically, the index…

10.12.2026
This week’s chart highlights the accelerating growth of electricity demand in the U.S., which has been driven primarily by the…

10.08.2026
LIVE WEBINAR — OCTOBER 22 Please join Marquette’s research team for our 3Q 2026 Market Insights Webinar…

10.05.2026
For investors, the spookiest thing about October might not be the ghosts and monsters that are bound to show up…

09.28.2026
The phrase “expectations of higher inflation” has become a staple in financial news to explain the increase in nominal U.S….
Research alerts keep you updated on our latest research publications. Simply enter your contact information, choose the research alerts you would like to receive and click Subscribe. Alerts will be sent as research is published.
We respect your privacy. We will never share or sell your information.
If you have questions or need further information, please contact us directly and we will respond to your inquiry within 24 hours.
Contact Us >