11.03.2025
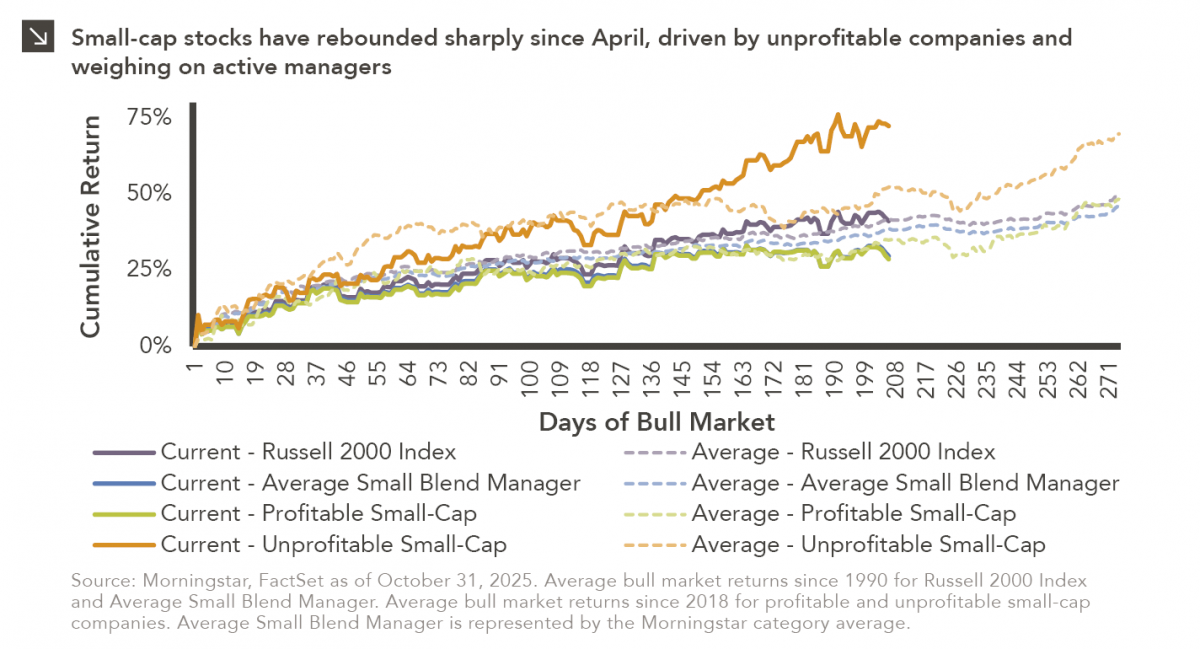
No Small Headwind for Small-Cap Managers
Small-cap equities are in a prolonged period of underperformance relative to large-cap stocks, but this trend has shown early signs…

As markets continue to reach new all-time highs many investors are wondering how much more runway is left for the current 8-year bull market. While different valuation metrics will tell different stories, it can be helpful to look at what Warren Buffett has dubbed the single best measure of long-term market valuations.
For this week’s chart of the week, we take a look at the “Buffett Indicator” which consists of the Wilshire 5000 index market cap divided by the quarterly nominal GDP of the U.S. economy. As of the third quarter, the reading stood at 121%, just below its two decade high and 45-year two standard deviation average. These readings would suggest that the market is overbought. However, there is no perfect market indicator, so while the Buffett Indicator can be used as a sign of caution to investors who are considering committing further funds to U.S. equities, it should not be relied upon as an exclusive predictor of future market returns. Although the Buffett Indicator suggests that valuation levels are high, positive earnings growth began to emerge in late 2016 and could provide further support for current valuations if companies can deliver on profit projections. These statistics will be watched closely as the year unfolds to gauge the future direction of the U.S. equity market.
The opinions expressed herein are those of Marquette Associates, Inc. (“Marquette”), and are subject to change without notice. This material is not financial advice or an offer to purchase or sell any product. Marquette reserves the right to modify its current investment strategies and techniques based on changing market dynamics or client needs.
11.03.2025
Small-cap equities are in a prolonged period of underperformance relative to large-cap stocks, but this trend has shown early signs…
10.27.2025
To paraphrase a quote from former President George W. Bush: “Fool me once, shame on… shame on you. Fool me…

10.22.2025
This video is a recording of a live webinar held October 22 by Marquette’s research team analyzing the third quarter…
10.22.2025
I spent the past weekend at my alma mater to watch them play their biggest rival. Football weekends there are…
10.20.2025
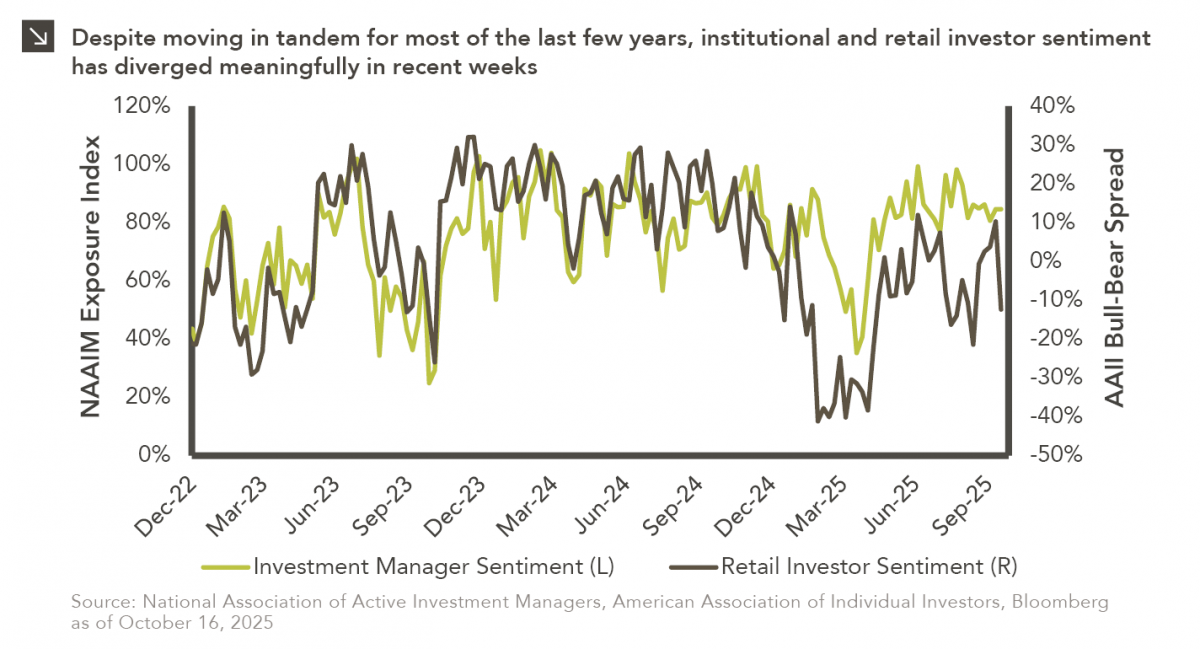
This week’s chart compares institutional and retail investor sentiment using two established indicators. Institutional sentiment is represented by the National…
10.13.2025
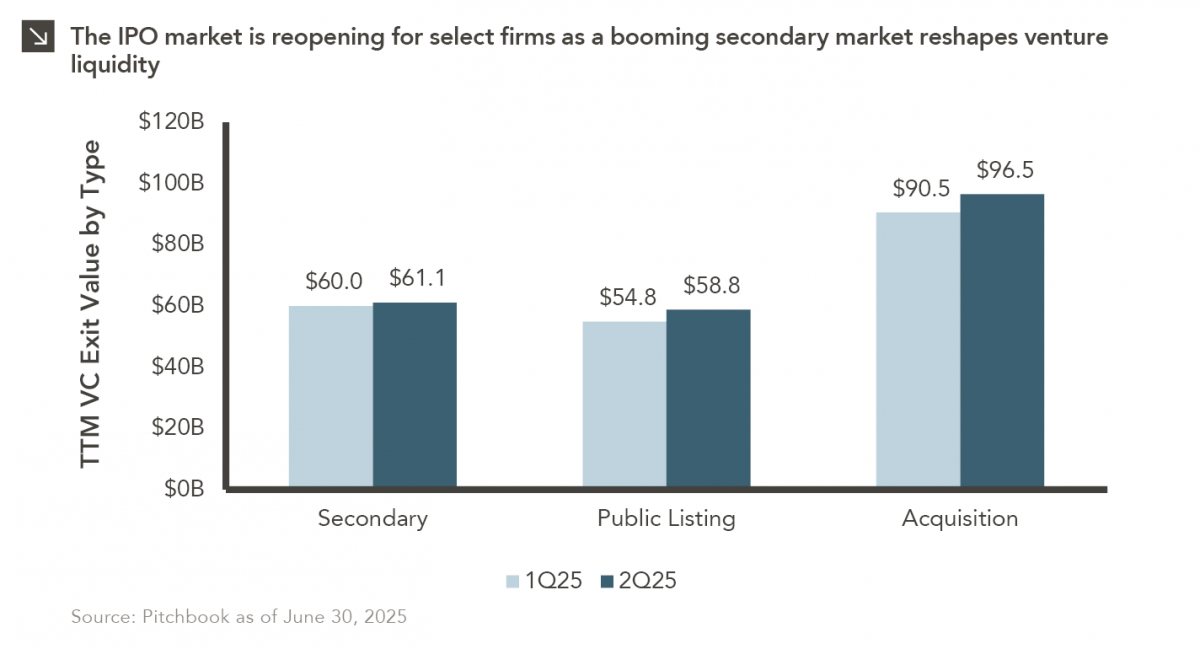
After a three-year drought, the IPO market is stirring again… but only for a select few. Just 18 companies have…
Research alerts keep you updated on our latest research publications. Simply enter your contact information, choose the research alerts you would like to receive and click Subscribe. Alerts will be sent as research is published.
We respect your privacy. We will never share or sell your information.
If you have questions or need further information, please contact us directly and we will respond to your inquiry within 24 hours.
Contact Us >