Mike Spychalski, CAIA
Vice President
This week’s chart of the week compares business spending (represented by non-defense capital goods orders) to employment (represented by total nonfarm employees) in the United States. As the chart illustrates, both employment and business spending have been steadily rising since the economic recovery began back in 2009. However, the growth of business spending, which contributed significantly to economic growth in the early stages of the recovery (increasing by an average of approximately $640 million per month from May 2009 through December 2011) has slowed as of late (increasing by an average of approximately $34 million per month from January 2012 through December 2013).
Employment growth, on the other hand, has been fairly steady over the past several years (increasing by an average of approximately 180,000 jobs per month each of the past three calendar years). With the ongoing strength in employment growth, the United States is approaching a new all-time high in total employment (i.e., peak employment). At the current rate of employment growth, the United States should reach a new peak employment this summer. This is a significant development because reaching new peak employment has historically led to significant growth in business spending, as businesses have to purchase new technology, equipment, and space to accommodate a larger workforce.
It will be important to monitor how businesses react once the economy reaches new peak employment. If business spending increases as it has in the past, it will provide another tailwind to an already strengthening economic recovery.

The opinions expressed herein are those of Marquette Associates, Inc. (“Marquette”), and are subject to change without notice. This material is not financial advice or an offer to purchase or sell any product. Marquette reserves the right to modify its current investment strategies and techniques based on changing market dynamics or client needs.
11.10.2025
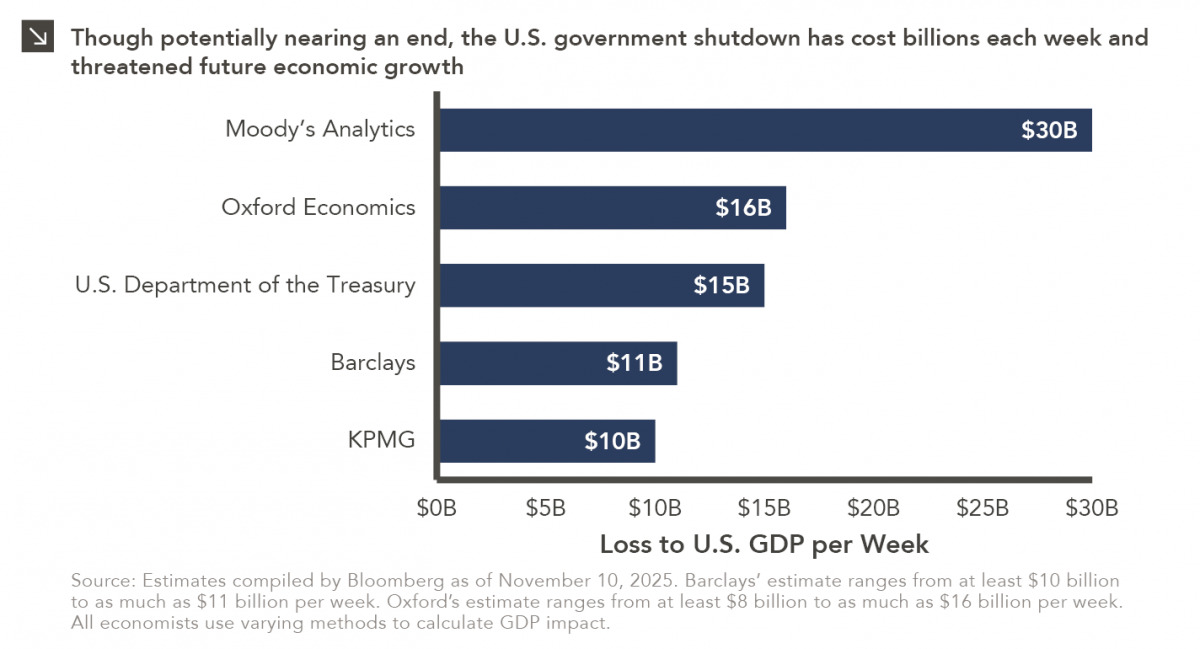
Over the weekend, the Senate overcame a key procedural obstacle in its attempt to end the record-breaking government shutdown, as…
11.03.2025
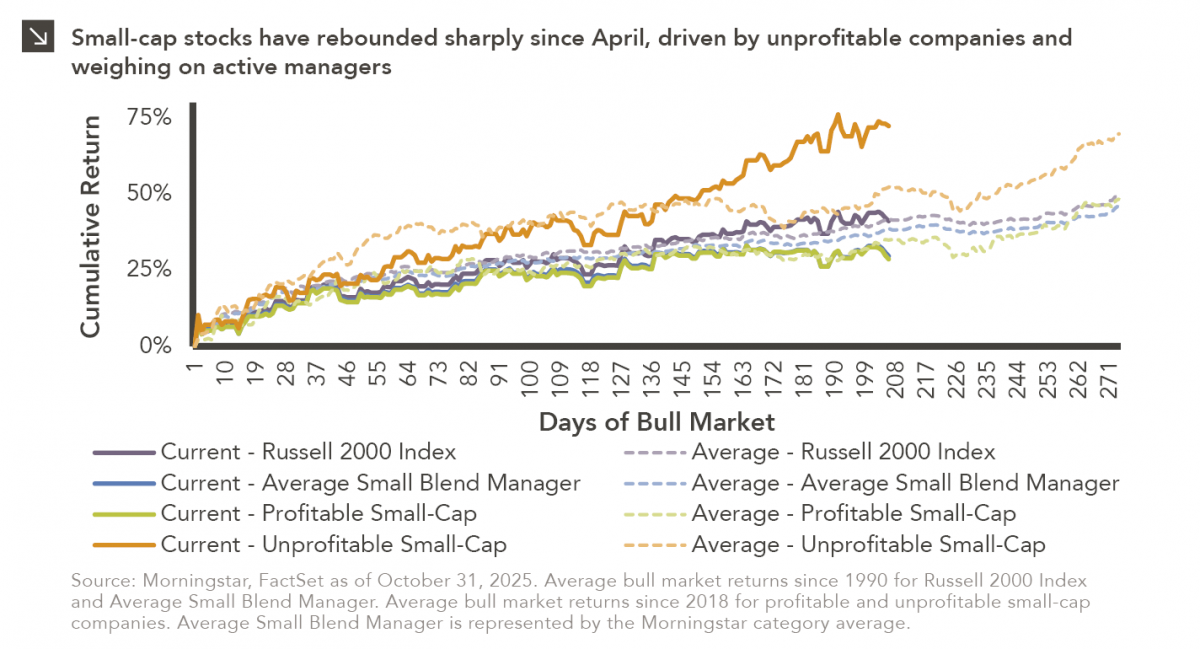
Small-cap equities are in a prolonged period of underperformance relative to large-cap stocks, but this trend has shown early signs…
10.27.2025
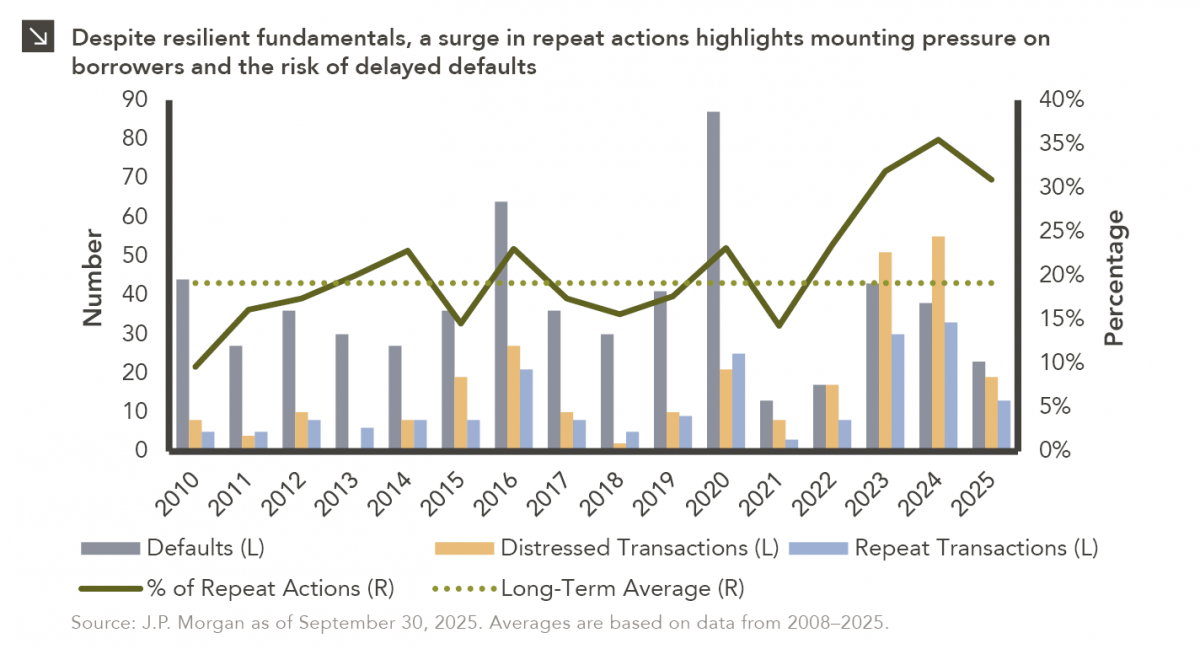
To paraphrase a quote from former President George W. Bush: “Fool me once, shame on… shame on you. Fool me…

10.22.2025
This video is a recording of a live webinar held October 22 by Marquette’s research team analyzing the third quarter…
10.22.2025
I spent the past weekend at my alma mater to watch them play their biggest rival. Football weekends there are…
10.20.2025
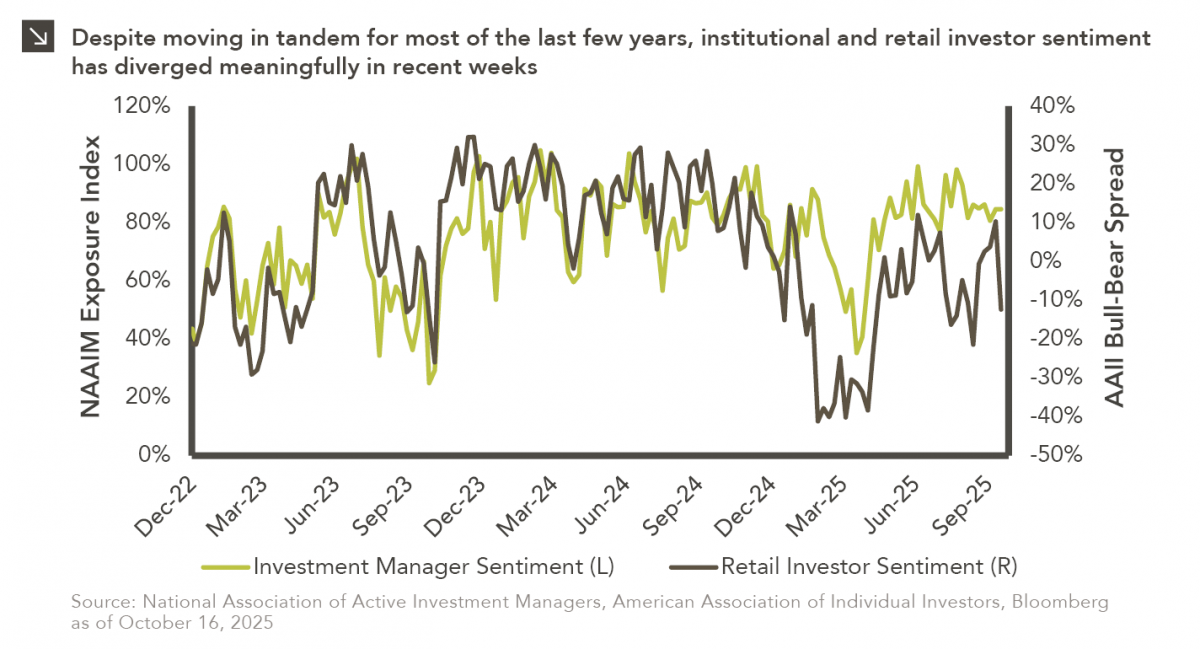
This week’s chart compares institutional and retail investor sentiment using two established indicators. Institutional sentiment is represented by the National…
Research alerts keep you updated on our latest research publications. Simply enter your contact information, choose the research alerts you would like to receive and click Subscribe. Alerts will be sent as research is published.
We respect your privacy. We will never share or sell your information.
If you have questions or need further information, please contact us directly and we will respond to your inquiry within 24 hours.
Contact Us >