11.03.2025
No Small Headwind for Small-Cap Managers
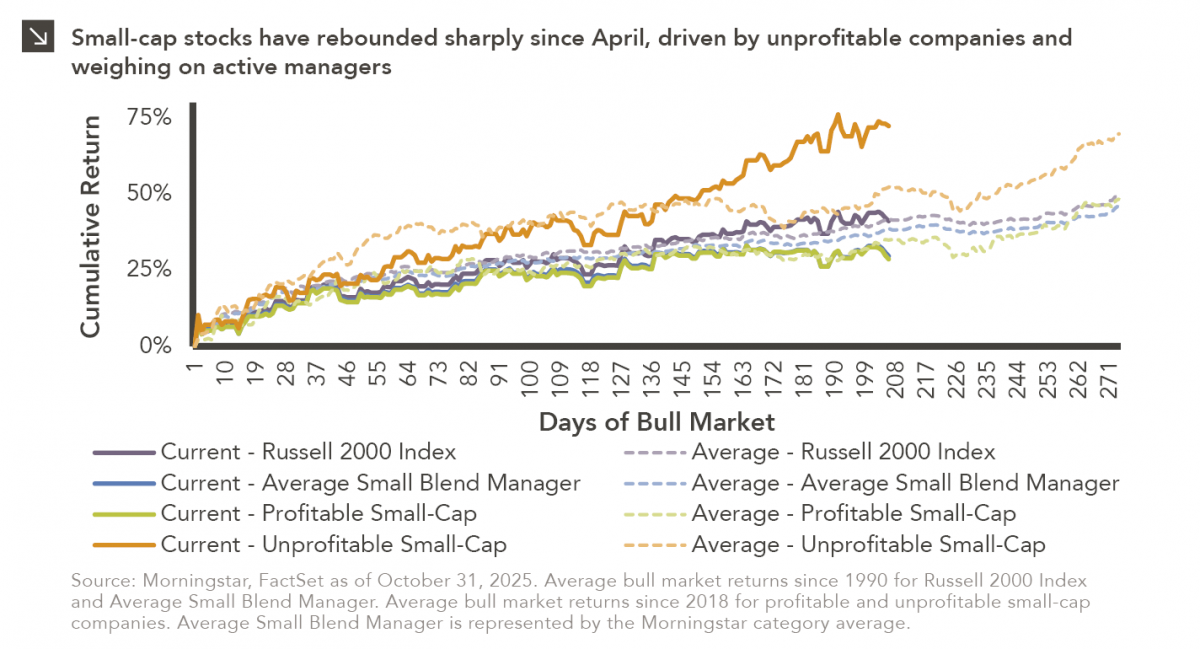
Small-cap equities are in a prolonged period of underperformance relative to large-cap stocks, but this trend has shown early signs…

The Implied Correlation Index measures the average correlation of the stocks in the S&P 500 index. When the index is high, individual stocks are more likely to move in tandem with the broad index; when it is low, return dispersion among stocks in the index will be higher.
Looking at the 1 year chart above, the correlation downtrend is easily visible. With low correlation levels, opportunities should be present for active managers to find alpha and begin outperforming their benchmarks once again. With higher return dispersion, active managers will have an increased opportunity to pick winning stocks. If correlations continue this pattern, it should be easier to identify successful active managers rather than those who have ridden the macro trends of the market in recent years. If nothing else, falling correlations within the index provide an opportunity for active managers to recover from general underperformance versus the benchmark which has plagued them in recent years.
The opinions expressed herein are those of Marquette Associates, Inc. (“Marquette”), and are subject to change without notice. This material is not financial advice or an offer to purchase or sell any product. Marquette reserves the right to modify its current investment strategies and techniques based on changing market dynamics or client needs.
11.03.2025
Small-cap equities are in a prolonged period of underperformance relative to large-cap stocks, but this trend has shown early signs…
10.27.2025
To paraphrase a quote from former President George W. Bush: “Fool me once, shame on… shame on you. Fool me…

10.22.2025
This video is a recording of a live webinar held October 22 by Marquette’s research team analyzing the third quarter…
10.22.2025
I spent the past weekend at my alma mater to watch them play their biggest rival. Football weekends there are…
10.20.2025
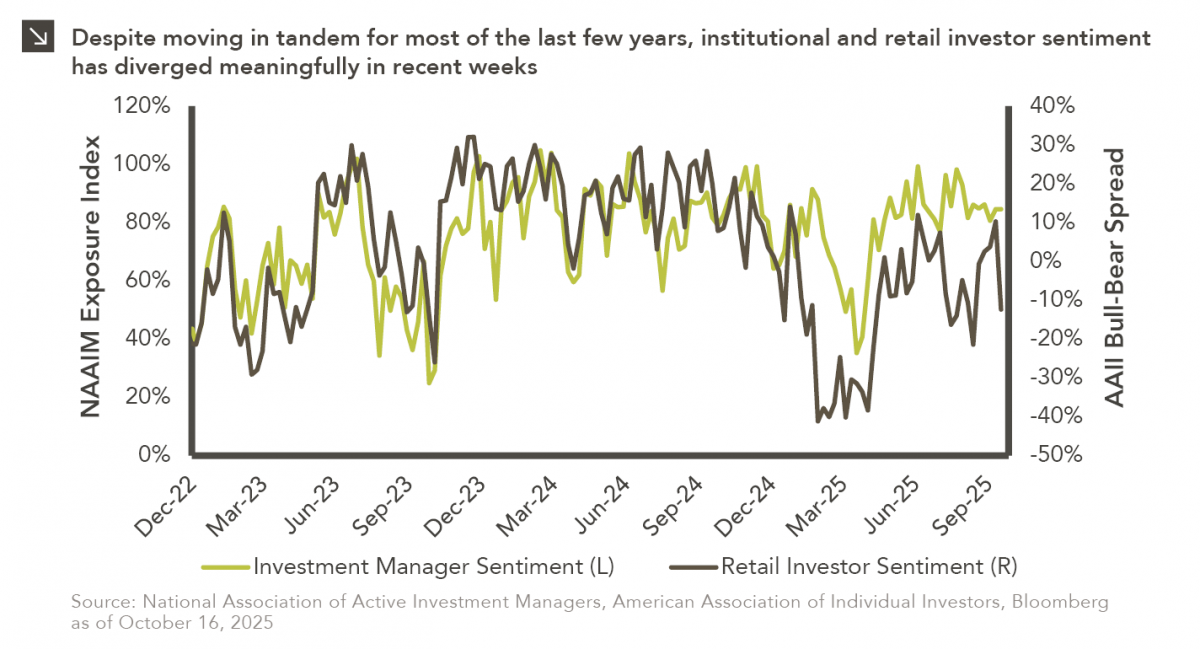
This week’s chart compares institutional and retail investor sentiment using two established indicators. Institutional sentiment is represented by the National…
10.13.2025
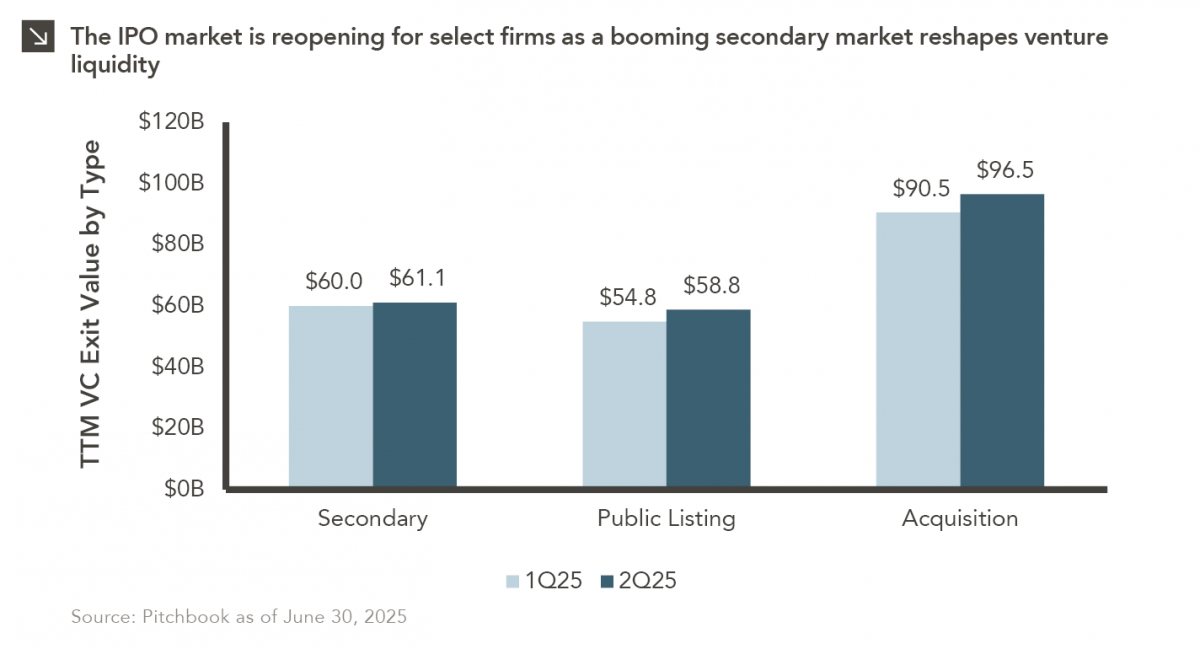
After a three-year drought, the IPO market is stirring again… but only for a select few. Just 18 companies have…
Research alerts keep you updated on our latest research publications. Simply enter your contact information, choose the research alerts you would like to receive and click Subscribe. Alerts will be sent as research is published.
We respect your privacy. We will never share or sell your information.
If you have questions or need further information, please contact us directly and we will respond to your inquiry within 24 hours.
Contact Us >