Greg Leonberger, FSA, EA, MAAA, FCA
Partner, Director of Research
This week’s chart examines the frequency and magnitude of market corrections in the U.S. equity market, as measured by the S&P 500 Index. A market correction is defined as a decrease of 10% or more within one calendar year. Using data back to 1950, we found that every year featured at least one market drawdown, and over half of those years (35 of the 62 years, approximately 56%) were true market corrections. What is even more interesting is how large some of these corrections were, with 11 of those years seeing intra-year declines of over 20%. So while the steep drop over the last week has contributed to an 18% decline in the S&P 500 Index (through Monday’s close), perhaps investors can find some reassurance knowing that more severe market corrections have occurred in the past.

The opinions expressed herein are those of Marquette Associates, Inc. (“Marquette”), and are subject to change without notice. This material is not financial advice or an offer to purchase or sell any product. Marquette reserves the right to modify its current investment strategies and techniques based on changing market dynamics or client needs.
02.02.2026
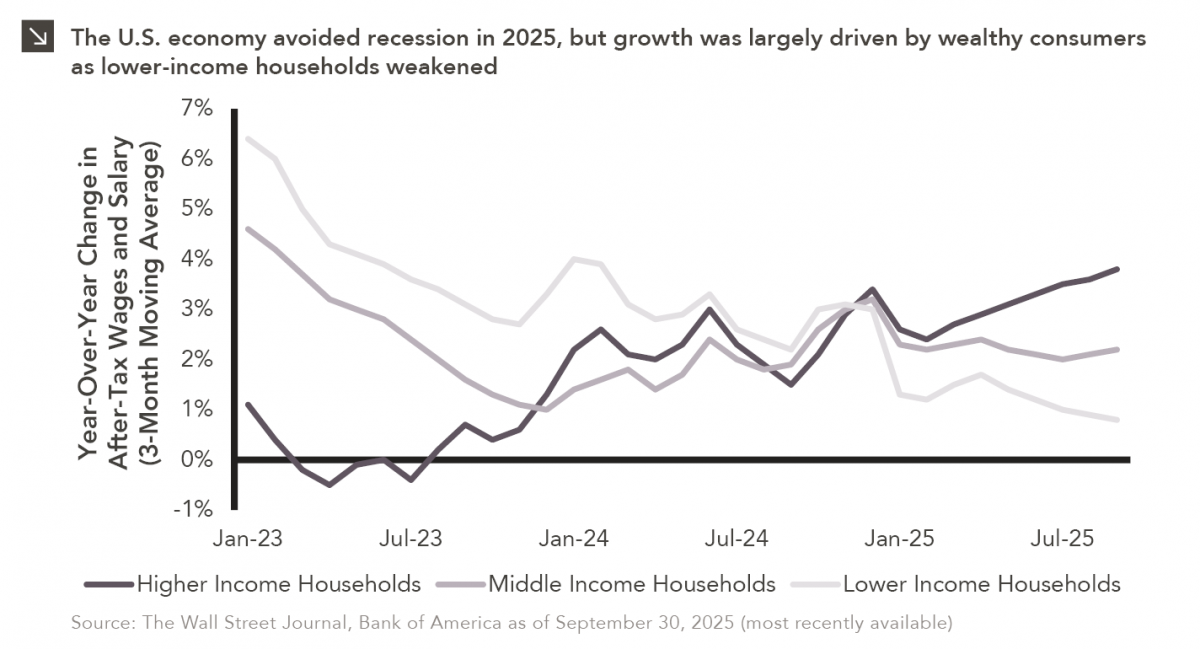
Macroeconomic forecasting is challenging in the best of times and proved downright impossible in 2025, which saw high levels of…
01.26.2026
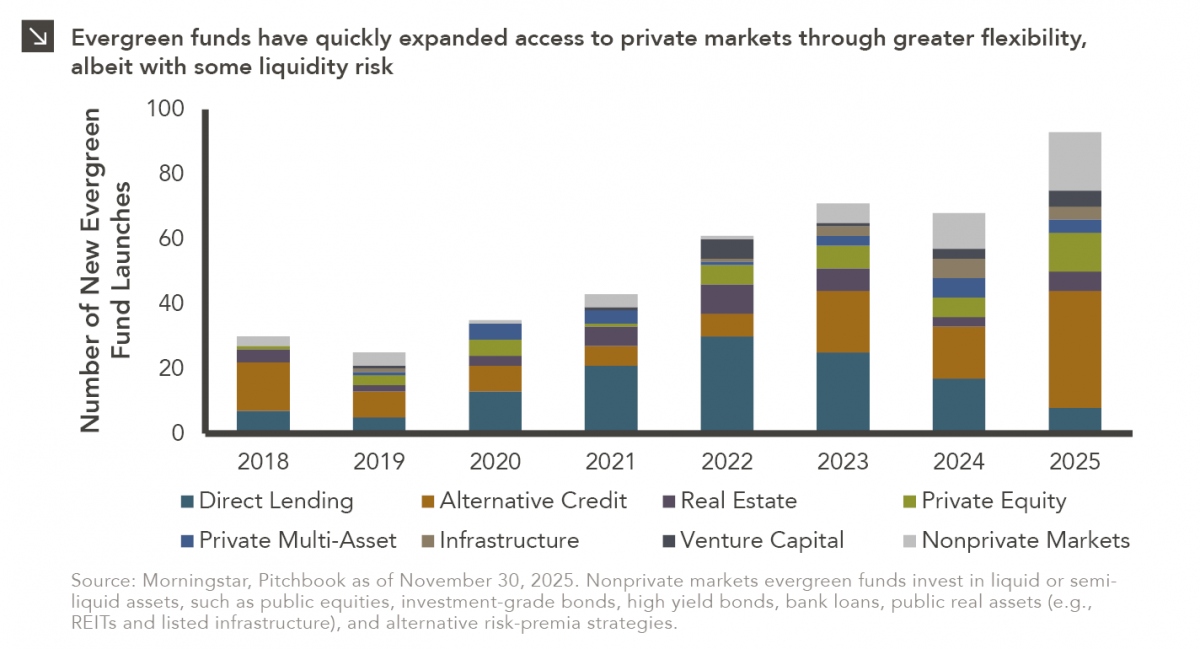
In recent years, access to traditionally illiquid private markets has expanded through the rapid growth of evergreen funds, which provide…
01.22.2026
Anyone who has gone snowmobiling knows it can be simultaneously exhilarating and terrifying. Throttling across snow and through a forest…
01.20.2026
Last week, Alphabet joined NVIDIA, Microsoft and Apple as the only companies to ever reach a market capitalization of $4…

01.07.2026
This video is a recording of a live webinar held January 15 by Marquette’s research team analyzing 2025 across the…
01.12.2026
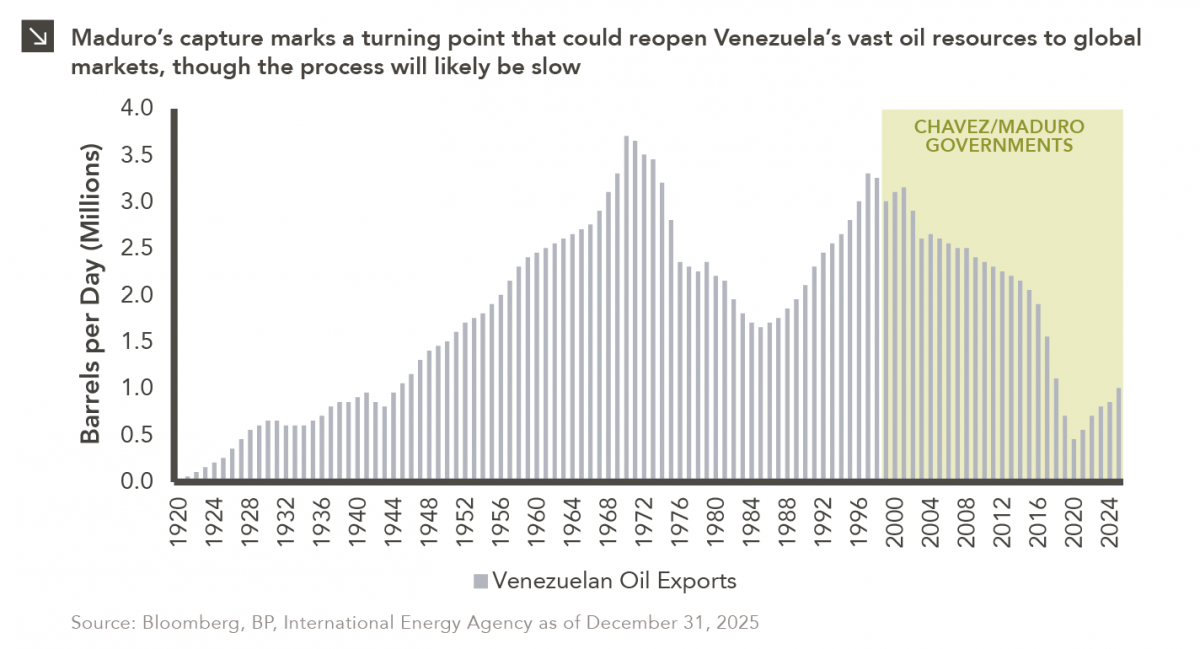
The capture of Venezuelan president Nicolás Maduro is a watershed moment for a country whose natural resource economy has been…
Research alerts keep you updated on our latest research publications. Simply enter your contact information, choose the research alerts you would like to receive and click Subscribe. Alerts will be sent as research is published.
We respect your privacy. We will never share or sell your information.
If you have questions or need further information, please contact us directly and we will respond to your inquiry within 24 hours.
Contact Us >