01.26.2026
Pining for Evergreens
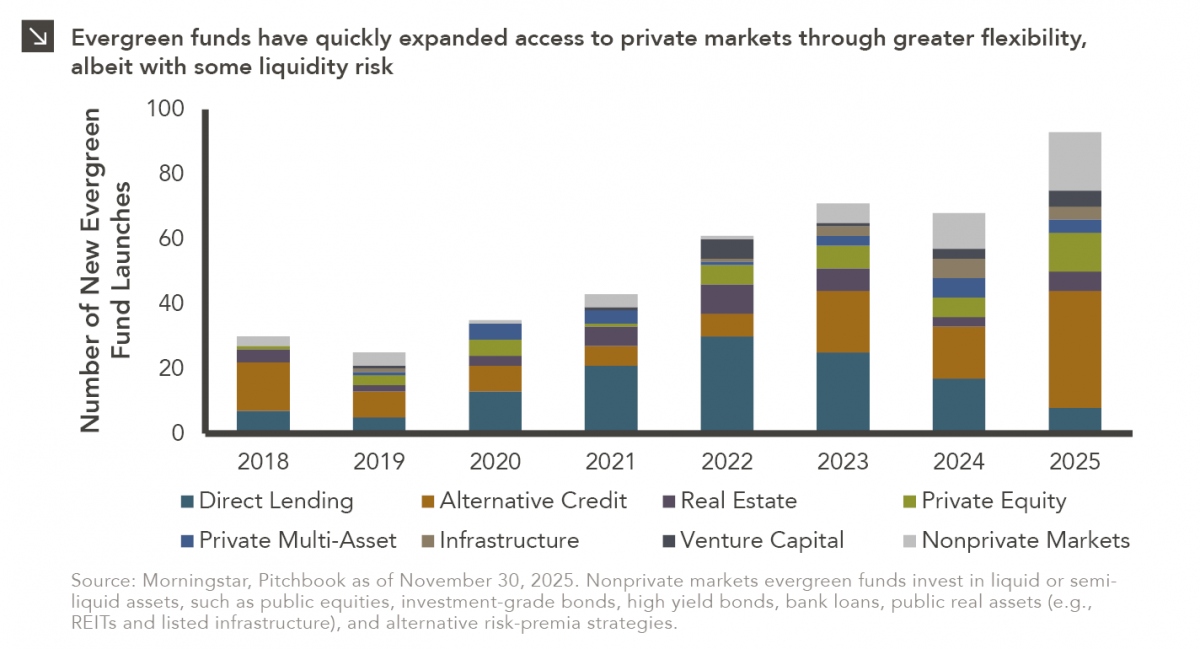
In recent years, access to traditionally illiquid private markets has expanded through the rapid growth of evergreen funds, which provide…

High yield bonds enjoyed significant tailwinds in 2016:
All of this fueled a 17.1% return for high yield bonds during 2016, as measured by the Barclays U.S. Corporate High Yield Bond Index. Of course, “bond math” dictates that returns for any sector of the asset class have a ceiling on price escalation, and high yield bonds may be in overvalued territory right now. As we can see in this week’s chart, spreads1 — which are a primary valuation metric for bonds — are tight at the moment, at 388 basis points on January 31 for the Barclays U.S. Corporate High Yield Bond Index compared with its ten-year average of 606 basis points. In other words, current high yield bond spreads are more than 200 basis points tighter than long-term average spreads. If we exclude the financial crisis years of 2008 and 2009, the long-term average spread is 508 basis points and current spreads are still considered tight. Current spreads are about as tight as they were prior to the shale oil crisis of 2014-2015.
High yield spreads typically compress to the point when a market correction occurs. This market correction typically features spread widening. Because of such tight spreads at the moment, as well as other fundamentals that we track such as aggressive use of proceeds and aggressive lower-quality issuance, spreads are more likely to widen than further tighten. As such, we recommend that clients reallocate to policy weights and maintain a cautious and conservative outlook for high yield bond allocations.
___________________
1 Defined as the excess yield above U.S. Treasury bond yields
The opinions expressed herein are those of Marquette Associates, Inc. (“Marquette”), and are subject to change without notice. This material is not financial advice or an offer to purchase or sell any product. Marquette reserves the right to modify its current investment strategies and techniques based on changing market dynamics or client needs.
01.26.2026
In recent years, access to traditionally illiquid private markets has expanded through the rapid growth of evergreen funds, which provide…
01.22.2026
Anyone who has gone snowmobiling knows it can be simultaneously exhilarating and terrifying. Throttling across snow and through a forest…
01.20.2026
Last week, Alphabet joined NVIDIA, Microsoft and Apple as the only companies to ever reach a market capitalization of $4…

01.07.2026
This video is a recording of a live webinar held January 15 by Marquette’s research team analyzing 2025 across the…
01.12.2026
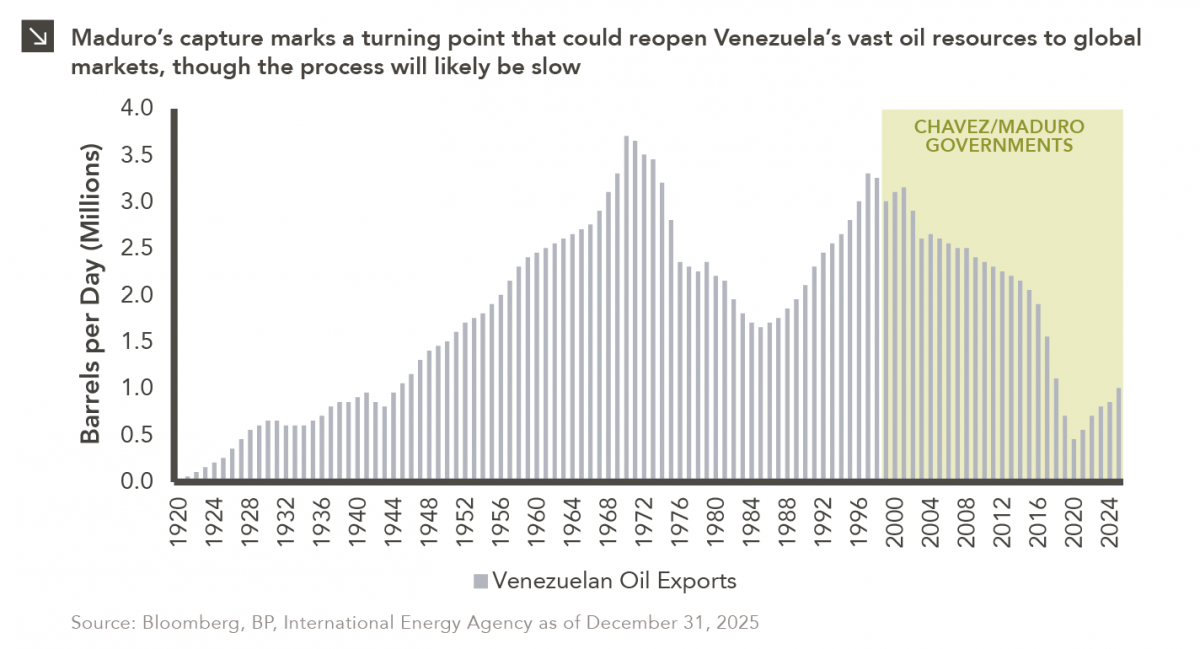
The capture of Venezuelan president Nicolás Maduro is a watershed moment for a country whose natural resource economy has been…

01.05.2026
The development of artificial intelligence is advancing along two largely distinct paths. The first centers on generative AI powered by…
Research alerts keep you updated on our latest research publications. Simply enter your contact information, choose the research alerts you would like to receive and click Subscribe. Alerts will be sent as research is published.
We respect your privacy. We will never share or sell your information.
If you have questions or need further information, please contact us directly and we will respond to your inquiry within 24 hours.
Contact Us >